Now that the first trading week of 2023 is in the books, I’m starting to grasp the types of setups that are working in the current market…
But first, most of you know that I have a negative bias…
I love to short high-flying momentum stocks by buying puts near the top. This is my bread-and-butter strategy (one that’s made me a millionaire several times over).
But as I’ve mentioned recently, no setup lasts forever.
And when your go-to patterns stop working, you must have a deep and diverse playbook of alternate strategies to choose from.
Take me, for example…
With most stocks far off their highs, there’s a lack of blow-off top patterns for me to short right now.
Will there be a time when shorting momentum stocks starts working again? Of course. The markets are constantly changing.
But for now, I’m focusing on some different setups that have proven they’re working in this environment.
Keep reading and I’ll show you the two ‘reversal patterns’ I’m currently scanning the market for…
Why I’m Looking for Reversal Setups
A main pillar of my trading strategy is trying to time pattern reversals.
After a stock has been green (or red) for several days (or weeks) in a row, the risk/reward is best trading in the opposite direction of the trend.
This is a dangerous game, but the rewards can be enormous…
If you can time buying a confirmed bottom — or shorting a euphoric top — it will likely be one of the best trades of your life.
Let me explain…
When I’m shorting blow-off tops, I try to time it perfectly so that I’m buying puts right before an extremely bullish chart gets destroyed back to the downside.
Are you familiar with this trading “loophole?”

Are you familiar with the “loophole” that helps small accounts grow exponentially?
No, it doesn’t have anything to do with penny stocks or crypto…
And this strategy works regardless of whether the markets are up OR down…
This little-known options “loophole” is something you can use to grow your trading account right now…
But as I mentioned, blow-off tops are hard to come by in this market…
That said, just like momentum runs inevitably run out of steam … short-term bear markets in hot stocks usually end with sharp reversals to the upside.
These bullish, bottomed-out pivots can be incredible call-trading opportunities. When a stock hits a hard bottom, it can be like a blow-off top in reverse.
In my opinion, two specific chart patterns can indicate a near-term bottom is forming…
The First Green Day Pattern
One of the most valuable things I learned in Tim Sykes’ Trading Challenge was the first green day pattern…
First green days often emerge after stocks have been in steady downtrends…
Following several red daily closes in a row, the first green day can cause a huge surge to the upside as shorts cover and bulls rally.
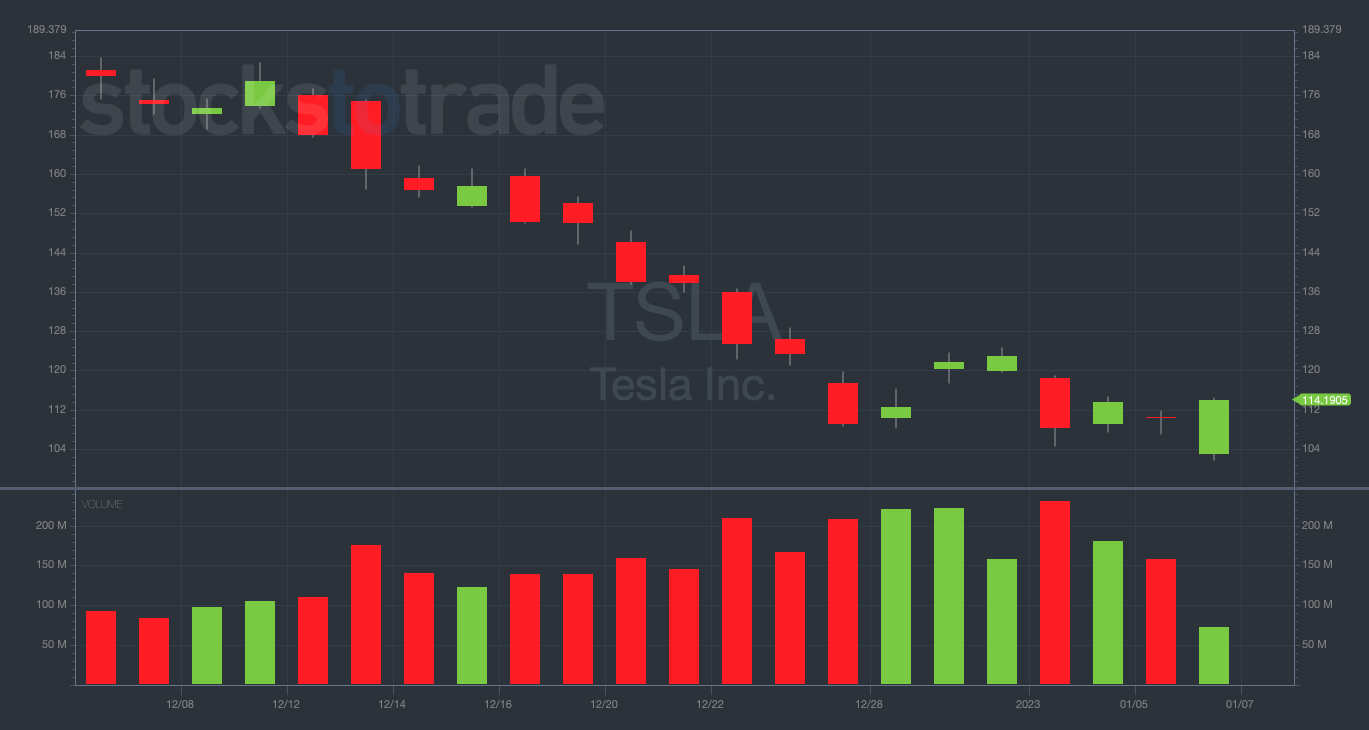
A perfect recent example of the first green day pattern is Tesla Inc. (NASDAQ: TSLA)…
TSLA 1-month daily chart — courtesy of StocksToTrade.com
Notice that after December 28, when TSLA saw its first green day (following seven red days in a row), the chart gapped up and held for two days.
This was a five-star call-buying opportunity brought to you by the first green day.
I’ll be looking for more setups like this in the coming weeks…
The Double Bottom Pattern
Another bullish signal is when charts hit a double bottom — bouncing off the same low price level twice.
Double bottoms indicate that the price level in question has serious support.
If the chart bounces off of the double bottom level, it often soars in the days following…
Take a look at the recent double bottom on the Amazon.com, Inc. (NASDAQ: AMZN) chart for a good example of this concept…
AMZN 1-month daily chart — courtesy of StocksToTrade.com
On Friday, AMZN re-tested its lows near $81.50 … then blasted off into the close, up more than 3.5% on the day.
Double bottoms are working right now. Don’t sleep on them.
Final Thoughts
The market seems to be finding its footing, at least for now…
Look out for first green days and double bottoms to get in on some potentially excellent setups in this environment.
Keep evolving!


