- How (and why) mysterious traders buy tens of millions of dollars worth of January options every year…
- Three stocks with the biggest-money strike prices remaining for January 2022…
- PLUS — the perils of buying far out of the money options! WARNING: Don’t do it!
Outsized option bets, illustrated through large open interest (OI) on contracts, can provide traders with an indication as to where market whales believe future price action is heading.
While no one has a crystal ball, and open interest is never a guarantee of an impending move, it can be a huge hint for options traders who scan the market thoroughly.
With that in mind, today we’ll break down three of the biggest options bets remaining on January 2022 strike prices. We’ll go over what Evolvers can learn from these setups (and how you might find similar plays in the future). But first…
5 Tickers With Explosive Action Potential
I’ve known Tim Bohen, lead trainer of StocksToTrade, for years. We both found our trading legs in Tim Sykes’ Trading Challenge.
We have very different perspectives when it comes to the markets. For example, he loves Tesla as a long position, and I’ve been known to short it. That’s what makes trading so enthralling — so many traders with so many different perspectives. But it’s smart to learn from multiple sources.
Bohen is an incredible mentor and analyst, and he’s put together a special report of 5 tickers that he thinks can outshine TSLA. And he has far more to offer. Learn more here!
Now, back to options.
Why You Should Pay Attention to January LEAPs
There’s a phenomenon that tends to happen toward the end of every year in the options market.
Monthly contracts expiring in mid-January — historical favorites of long-dated LEAP traders — edge dangerously close to their expiration dates. This can lead to unusually volatile price action (and even more extreme swings in option prices).
Most years, it’s an all-out war between market makers and options traders from mid-December to mid-January — coinciding nicely with the Santa Claus rally.
It makes sense. After all, many of these contracts have tens of millions of dollars riding on the price action of the underlying stock.
Let’s get into them…
iShares iBoxx High Yield Corporate Bond ETF (NYSE: HYG)
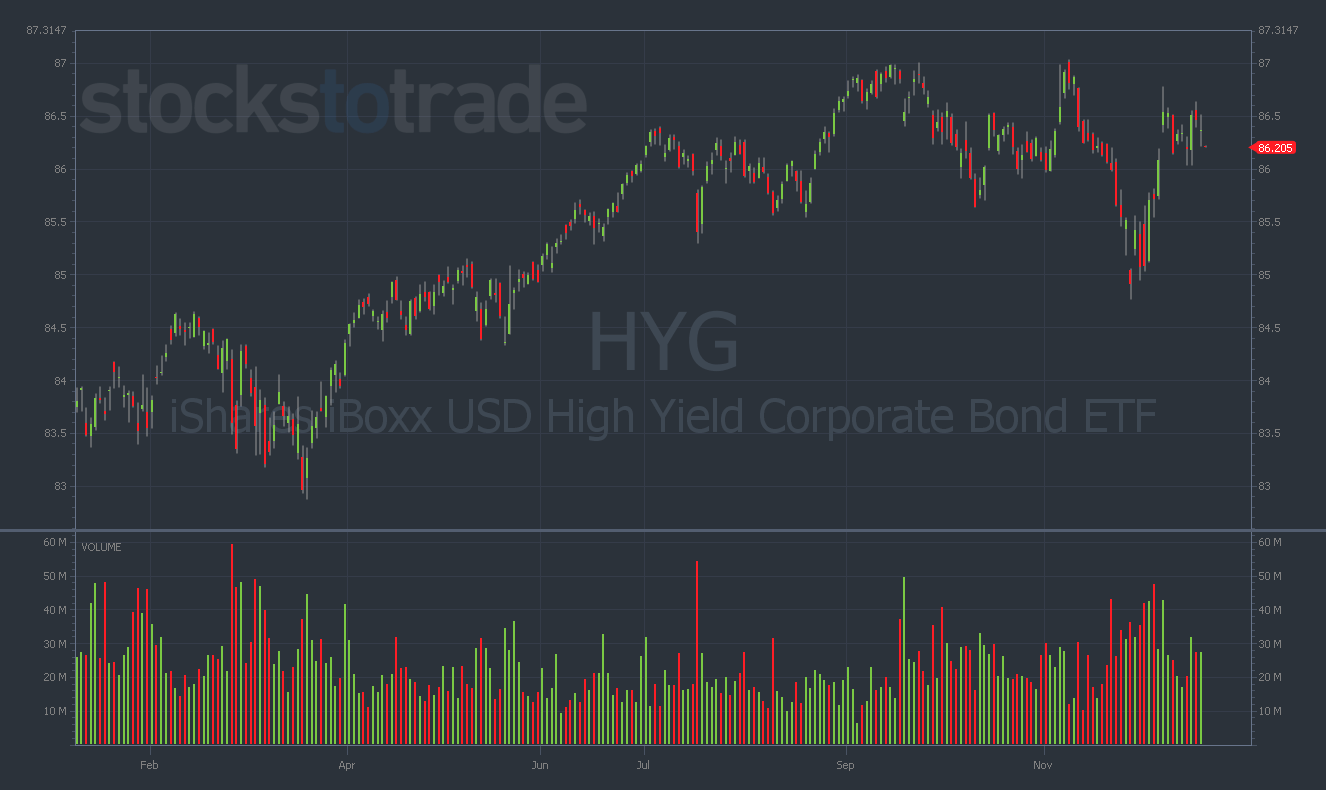
HYD YTD daily chart — courtesy of StocksToTrade.com
The award for the largest open interest of any contract in the entire derivatives market goes to … HYG 1/20/2022 $84 PUT with a whopping 380,000+ contracts in open interest!
Additionally, traders have piled on 240,000+ contracts on HYG 1/20/2022 $80 and $85 PUTS.
In total, these three strikes have approximately $35 million riding on them at the time of this writing. Moreover, all three strikes remain out of the money, as HYG is currently trading for $86.
But what is HYG? And why are options traders betting so much on the near-term downside?
HYG is a fund that tracks high-yield corporate debt. The huge amount of put-buying in the name suggests that traders think certain U.S. companies will default on their debt before January.
Why can’t trader and mentor Tim Bohen stop laughing?
He keeps “owning the hedgies” with this incredible strategy. (And he thinks it’s hilarious!)
To see how this could radically boost your trading, starting tomorrow…
To understand what might be driving this trade, take one look at what’s been going on with Evergrande in China.
This could be why traders are betting on defaults occurring within the U.S. soon. Debt figures are ballooning and interest rate hikes may loom on the horizon.
HYG isn’t super volatile, so the IV on the options is low and the contracts are relatively cheap. This is probably why traders are using HYG leaps as a mid-term trading instrument (or possibly as a hedge against a large stock portfolio).
I wouldn’t recommend this trade to Evolvers, but this MASSIVE bet is an interesting piece of data to use when assessing the big picture.
If you see HYG moving lower in the coming weeks, you’ll know why these bets were placed.
Ford Motor Company (NYSE: F)
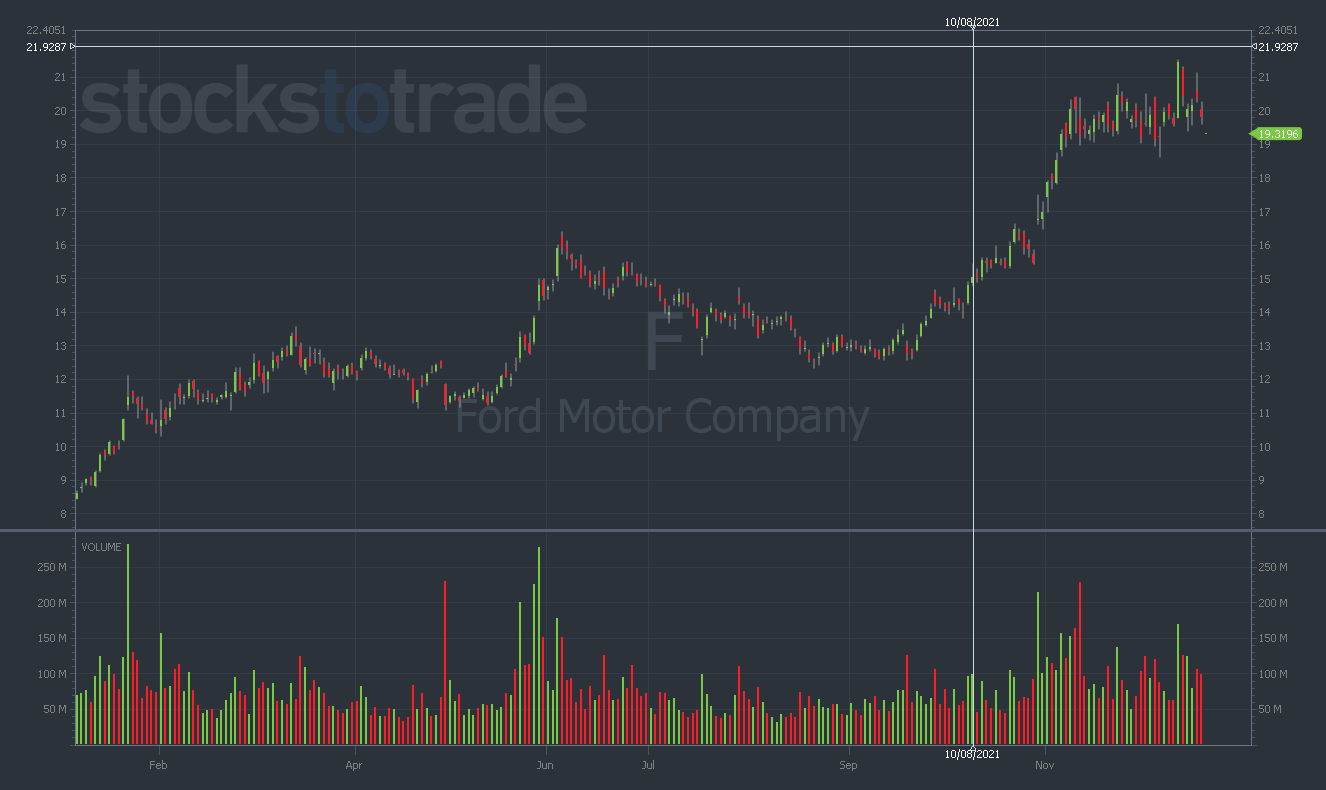
F YTD daily chart — courtesy of StocksToTrade.com
F has been a favorite ticker of options traders throughout 2021.
The volume’s consistently big on monthly strikes, but the open interest on the January LEAPs put every other expiration date to shame.
F 1/22/2022 $20 CALL has 200,000 contracts in open interest, while the 1/22/2022 $22 CALL has an additional 127,000 contracts open.
In less than a month, these two OTM strikes will determine the fate of over $20 million in options bets!
Why have traders been so bullish on F this year?
The legacy automaker has ripped to new highs on plans to enter the electric vehicle sector.
EVs have been an enormous story this year, with every car company in the world scrambling to get their wheels through the door.
F has had major success selling pre-orders for its F-150 Lightning electric truck.
Accelerate your learning curve with THIS…
If you’re just getting started…
Have a small account…
Or just want to accelerate your learning curve faster than you could ever do on your own.
Click here to check out this interview with Tim Sykes!
He reveals something you won’t want to miss…
That being said, I think the best part of this trade already passed. The smart traders would have cashed out both of those strikes several weeks ago.
But now we can use this legendary F setup as a lesson — an example of what to look for in the future.
F’s YTD chart is a real beauty. It went on two rip-roaring bull runs in 2021: once from $11–$16 in May and June, then again from $12–$20 in September and October.
F is currently trading for just over $19, having taken a dip with the rest of the market in December.
The open interest on the January chain has been astronomical all year. If you had scanned for the tickers with the highest open interest, you would’ve seen these F LEAPs.
And what do I always say? The best setups feature volume (check), volatility (check), and … a catalyst! The catalyst was the most important point in the F setup.
I think these options traders knew (or had a strong hunch) that F was about to announce an EV play. The January chain was getting loaded up in the early part of the year. And the buying hasn’t stopped since.
As soon as the company made it official on May 19, the price action took off. Up 125% YTD, F stock hasn’t been this bullish in years.
This sort of mid-term prediction is perfect for LEAPs. No one knew exactly when F would announce this, so playing monthlies or weeklies would’ve been less than ideal.
Instead, the traders who bought long-dated calls (and held patiently) were rewarded with insane gains.
Nokia Corporation (NYSE: NOK)
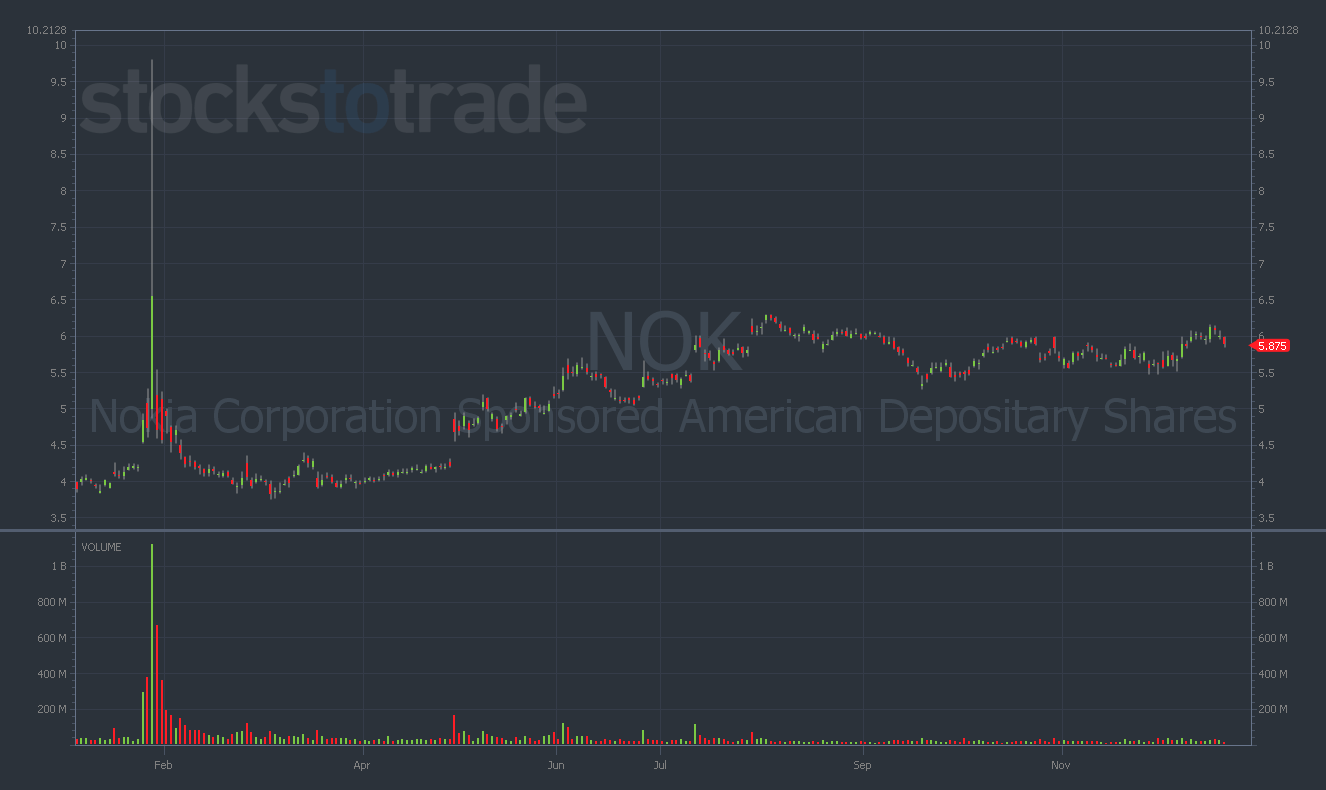
NOK YTD Daily Chart, courtesy of StocksToTrade.com
All year, NOK stood out from the crowd in the options market.
For months, call buyers have been pressing their advantage, purchasing hundreds of thousands of out-of-the-money contracts — worth tens of millions of dollars.
For much of this period, NOK stock traded sideways near multi-year lows. And IV was at rock bottom.
Back in May, I made notes on how huge the open interest was on certain NOK strikes.
The sheer volume of the contracts, coupled with the dollar value of the positions, is truly remarkable when viewed together:
NOK Call Strikes (as of 5/3/21)
Total Dollars of Open Interest
1/22 $4 C — 97k OI @$1.16 = $11.2 million
1/22 $5 C — 267k OI @$0.65 = $17.3 million
1/22 $7 C — 230k OI @$0.28 = $6.4 million
1/22 $10 C — 358k OI @$0.15 = $5.4 million
1/23 $4 C — 139k OI @$1.47 = $20.2 million
1/23 $5 C — 221k OI @$1.00 = $22 million
1/23 $7 C — 230k OI @$0.58 = $13.3 million
=
$99.6 MILLION
Since making these notes, NOK gained around 30%, and at their highs, many of these contracts were up 200%+!
You don’t need to know a thing about the options market to see how strong call buyers’ conviction has been in Nokia.
These contracts are depreciating assets, with the possibility of expiring worthless. Yet traders still laid out nearly $100 million behind the belief that NOK shares would exceed $5, $7, or even $10 by their respective expiration dates.
And once again, a lot of these traders won BIG. All of the $4 and $5 calls seem to be safely in the money, while the OTM strikes gained hundreds of percent at multiple points since these purchases.
Will NOK reach $7 or $10 by January 20? Probably not. This is why I recommend buying strikes close to the money as opposed to getting greedy with OTM strikes.
It’s also an illustration of how easy money can disappear in the options market. Traders lost tens of millions on these two strikes. Be careful.
But as long as you were disciplined with your chosen strikes, you could have exploited the massive open interest to your advantage — and potentially made a boatload on NOK calls.
Conclusion
As you can see, when tens of millions of dollars are bet on an options chain — there’s usually a major catalyst incoming.
These long-dated options aren’t the contracts I normally trade, but they could suit YOUR strategy. And as the new year approaches, January 2023 options will start to get loaded up by LEAP traders…
I suggest you pay close attention to how whales position their bets toward the beginning of the year. It could lead you to discover a variety of setups you might not have seen otherwise.
