Every Monday, I send Evolvers an email detailing my thoughts about the names I’m watching for potential trades that week.
You may think this is just another part of my teaching service, but that’s not entirely true.
In reality, I make my weekly watchlist as much for me as for you.
It’s extremely helpful to have all of my top watches in one document for quick reference throughout the week.
But it’s not just about being able to check off names as they move … it’s about being able to see the big picture.
When I write down my thoughts on each potential trade, I’m able to track my progress and identify any changes that need to be made. This helps me be a more successful trader.
And if you take the same steps on your own watchlist, you could potentially become a more competent trader as well.
So, let me ask you something…
Are you tired of feeling disorganized and overwhelmed when it comes to your trading strategy? Do you struggle to keep track of potential trades and make informed decisions throughout the week?
If you answered yes to either of these questions, keep reading…
Nvidia Corporation (NASDAQ: NVDA)

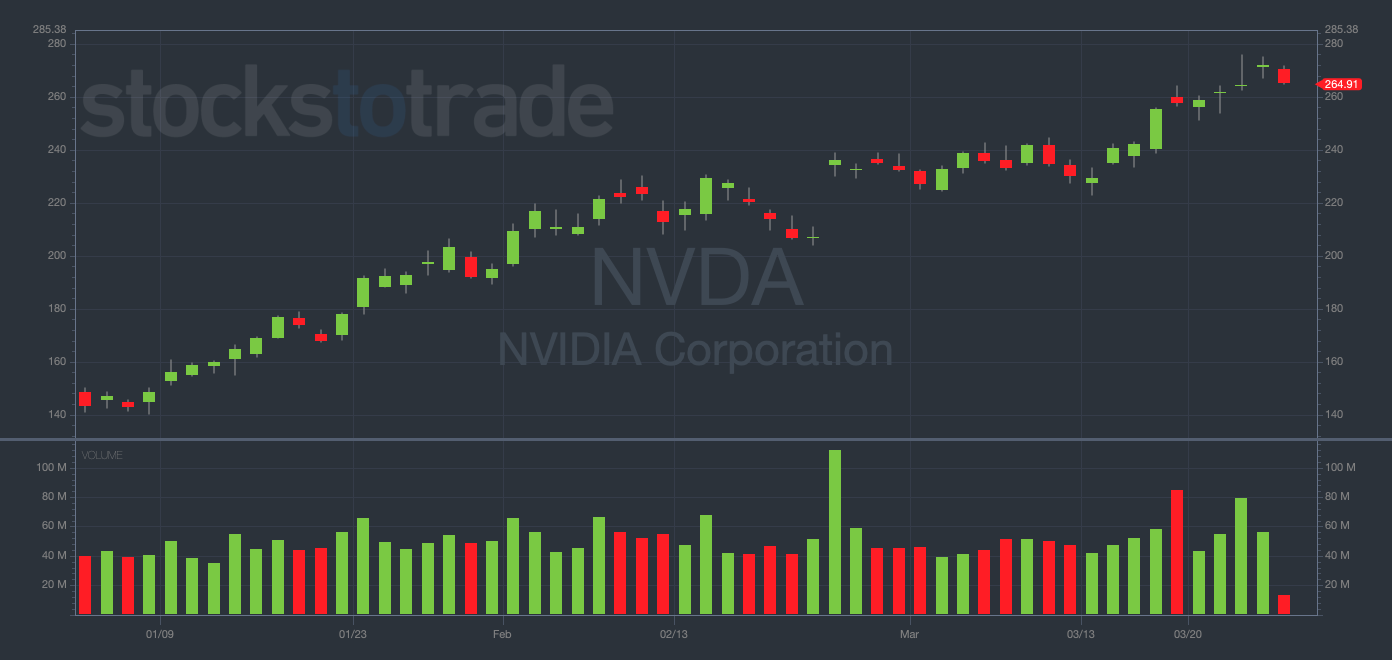
NVDA YTD daily chart — courtesy of StocksToTrade.com
NVDA has been one of my top stocks to trade for the past several years.
The popular semiconductor manufacturer remains a strong stock through regularly incredible earnings reports, cryptocurrency’s reliance on its chips, and now, the rise of AI…
But the reason NVDA is so amazing to trade is that the chart respects predictable indicators.
When NVDA stock hits a big round number, it tends to back off shortly thereafter. This is a dream for negative-bias traders like me.
As long as I’m disciplined with my timing and execution, I can usually count on NVDA breaking down at key support or resistance levels.
It’s a widely-traded, mega-volatile momentum stock where the reversals to the bottom are just as incredible as the ramps to the top.
And speaking of reversals to the downside, I think NVDA is far overdue for one…
The stock is up 85% YTD, 14% in the past month alone. There have been no major dips in the chart for the entirety of 2023.
Just look at the chart above … it’s gone up in a perfectly straight line.
This is one of the main reasons I bought NVDA 3/31/2023 $265 Puts for $6.25 on Friday.
Additionally, the chart is butting up against resistance at $270, so I think a correction could be right around the corner.
ProShares Ultra VIX Short-Term Futures ETF (BATS: UVXY)

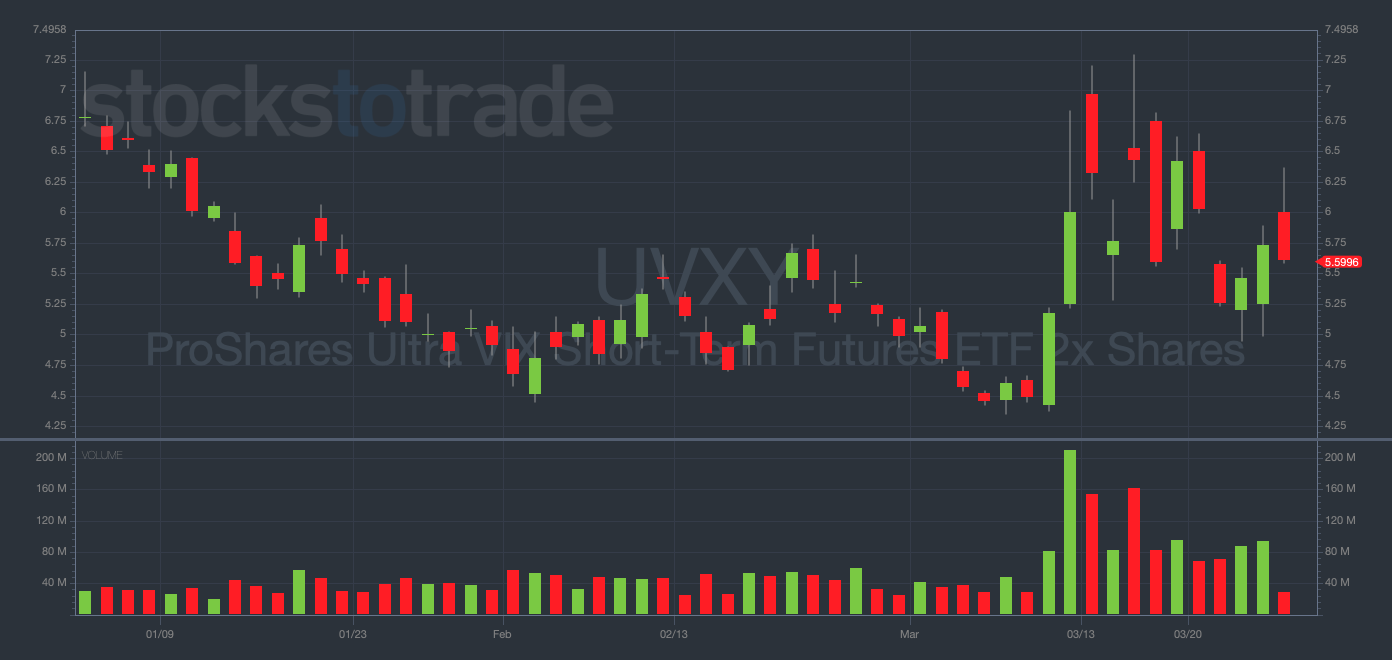
UVXY YTD daily chart — courtesy of StocksToTrade.com
Right now, it’s hard to gauge market direction by simply watching the major indexes.
The current volatility is so unpredictable that it’s a fool’s errand to read too far into the recent price action in the SPDR S&P 500 ETF Trust (NYSEARCA: SPY).
But luckily, there’s another chart to watch that can help us determine the sentiment within the overall market — UVXY.
Volatility is an excellent leading indicator of what may happen in the major indexes. When UVXY goes up, the market is probably going down.
For example, UVXY started spiking on March 8. Then, over the following two trading days, the SPY lost more than 3.5%.
And for options traders, UVXY is doubly important. If implied volatility (IV) is elevated, options premiums become more expensive.
This is why I want every Evolver to keep their eyes on UVXY this week.
SPDR S&P Regional Banking ETF (NYSEARCA: KRE)

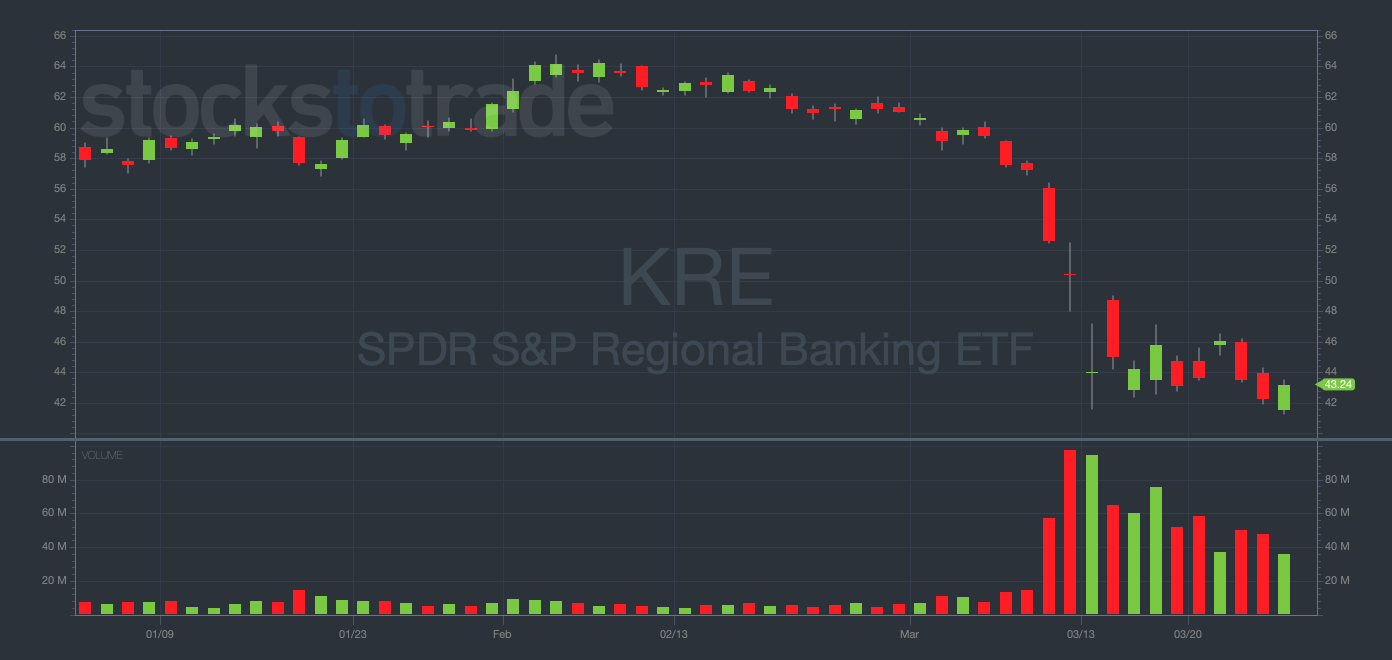
KRE YTD daily chart — courtesy of StocksToTrade.com
One basket of stocks has absolutely dominated the headlines over the past few weeks…
Of course, I’m talking about regional banks, which is why I’m watching KRE very closely this week…
KRE is a fund that tracks all of the U.S. regional banks. Though I probably won’t trade this exact ticker, I’ll be watching the chart as it’s a composite of the entire industry.
Let me explain…
The financial sector is under pressure due to recent solvency issues which were brought to the attention of the public during the Silicon Valley Bank collapse.
Now, regional bank stocks are getting sold off faster than tickets to a Taylor Swift concert.
One particularly brutal example is First Republic Bank (NYSE: FRC), which has lost 92% of its market value in two weeks!
But by this point, we all know about the troubles plaguing the banks. That said, the question for me is this…
Will the banking contagion spill over into other sectors and cause a major market downturn?
We’ll have to wait and see. Watch KRE to track the banks.
Final Thoughts
I want you to see how I think about the market, identify opportunities, and adjust my strategy as needed.
Study my watchlist. Learn from it. And you might find you can use it to become a more successful trader.
But remember, this is just a starting point…
The real work comes when you start putting your own trades on the line and building your watchlists.
So take some risks, learn from your mistakes, and keep evolving!

