Key Takeaways
- 4 stocks I’m tracking closely to start the new year…
- How (and when) I plan to trade these charts…
- Plus — identifying the critical price levels to watch…
Happy New Year, Evolvers! 2022 promises to bring fresh setups, new sectors, and never-before-seen trading opportunities.
But let’s be honest — the charts you’re most familiar with are often the best ones to focus on.
There’s a reason I continue to track the same stocks time and time again. Those setups contain the volume, volatility, and catalysts I love to look for.
With that in mind, let’s go over four stocks I’m watching to start 2022…
#1. Nvidia Corporation (NASDAQ: NVDA)
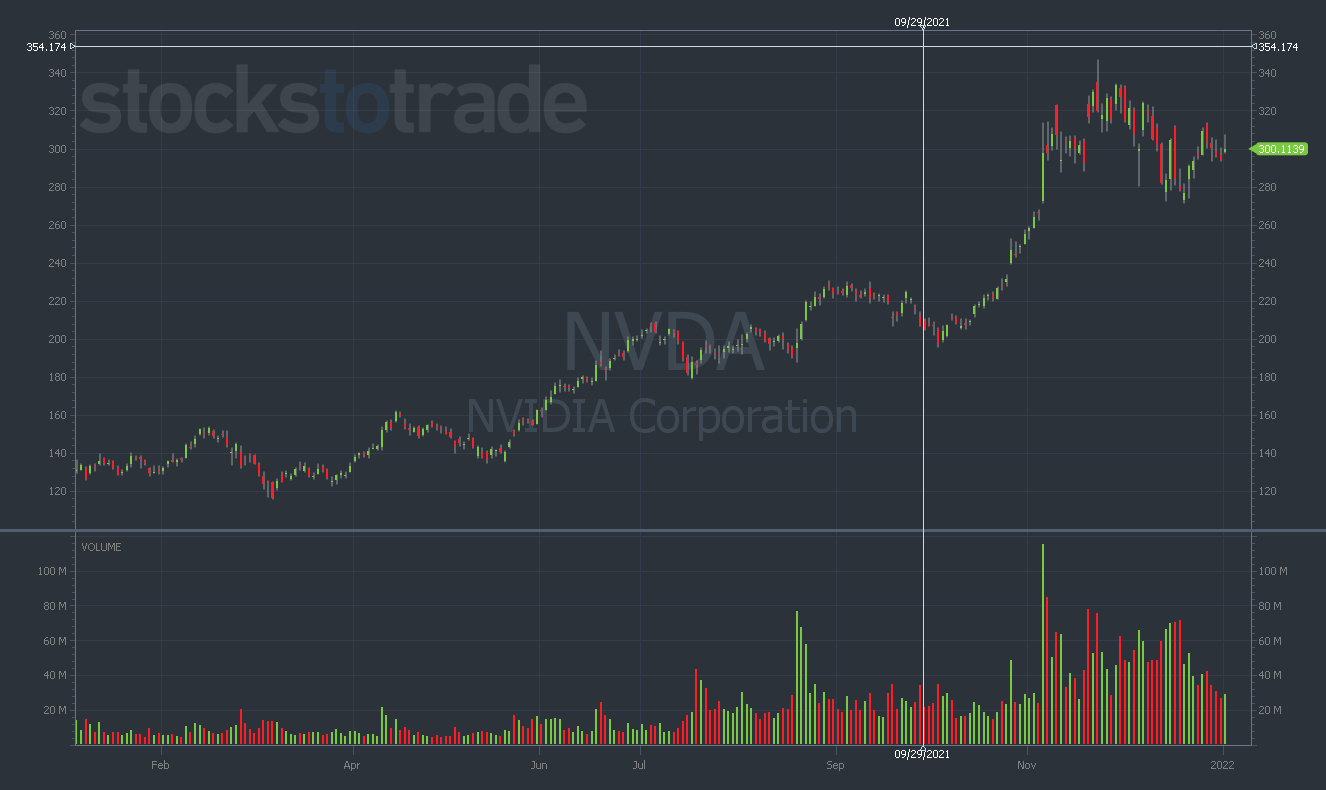
NVDA 1-year daily chart — courtesy of StocksToTrade.com
If you were an Evolver in 2021, you know I love to trade NVDA.
In 2022, NVDA remains a top watch for me. It’s one of the most high-flying, jacked-up momentum stocks on the planet — a beautiful trading vehicle.
But where does the NVDA chart stand at the moment? Is now a time to consider trading it or wait on the sidelines?
Since hitting a near-term top at $346, NVDA has been stuck in a steady downtrend. But although the overall trend may look negative, there are a few bullish notes to consider as well.
NVDA reclaimed the all-important $300 level at the start of last week (and has been trading sideways in that area since).
Additionally, the chart seems to be trading right along with the 50-day moving average. This is a positive signal for a stock with such bullish price action.
Regardless, I still recommend waiting on the sidelines for a better opportunity in NVDA. A clear break above (or below) $300 could open up a more tradeable setup in this chart.
#2. Tesla Inc. (NASDAQ: TSLA)

TSLA 1-year daily chart — courtesy of StocksToTrade.com
Ah, TSLA. How are you, my old friend? The answer seems to be … doing pretty well!
Elon Musk’s seemingly unstoppable EV manufacturer announced record delivery numbers over the weekend, catapulting TSLA shares as much as 10% on Monday.
If you know my trading style, you’d probably expect me to buy puts on TSLA after a 10% green day. But I won’t be doing that just yet.
Right now, I see TSLA trading in a range — from $900 to its previous all-time high of $1,243.
If you caught the bull end of this trade near $900, well played. The best of that move already happened.
Now I think the best strategy is to pay close attention to TSLA if it gets near its previous all-time high of $1,243.
A crack above this level would be a bullish indicator. However, a double top near the highs could signal impending downside in the chart.
Be patient at these levels. And whatever you do — don’t chase!
#3. Pfizer Inc. (NYSE: PFE)

PFE 1-year daily chart — courtesy of StocksToTrade.com
Throughout 2021, PFE made a name for itself as the ultimate vaccine stock.
But keep in mind that this designation is a double-edged sword. If the news cycle around vaccines is positive, PFE is generally blasting off.
However, whenever the news suggests some light at the end of the pandemic tunnel, the vaccine stocks often get destroyed over a matter of days — or hours.
Will 2022 bring the long-anticipated end of the pandemic? If yes, a landslide of bearish setups could emerge in PFE.
On the other hand, if case counts keep rising and new variants continue to pop up … PFE could remain bullish for the foreseeable future.
Big picture: PFE is up nearly 50% in two months. My gut tells me that the chart’s likely to go lower before it goes higher.
(The opening PFE trades of 2022 may have been a hint at this. We saw a steady stream of sell orders, gapping the stock down more than 4% on Monday).
Regardless, PFE isn’t volatile enough for me to consider a trade right now.
I’ll let it consolidate further under the $60 resistance level, hoping for a clear setup to reveal itself soon.
#4. AMC Entertainment Holdings Inc. (NYSE: AMC)
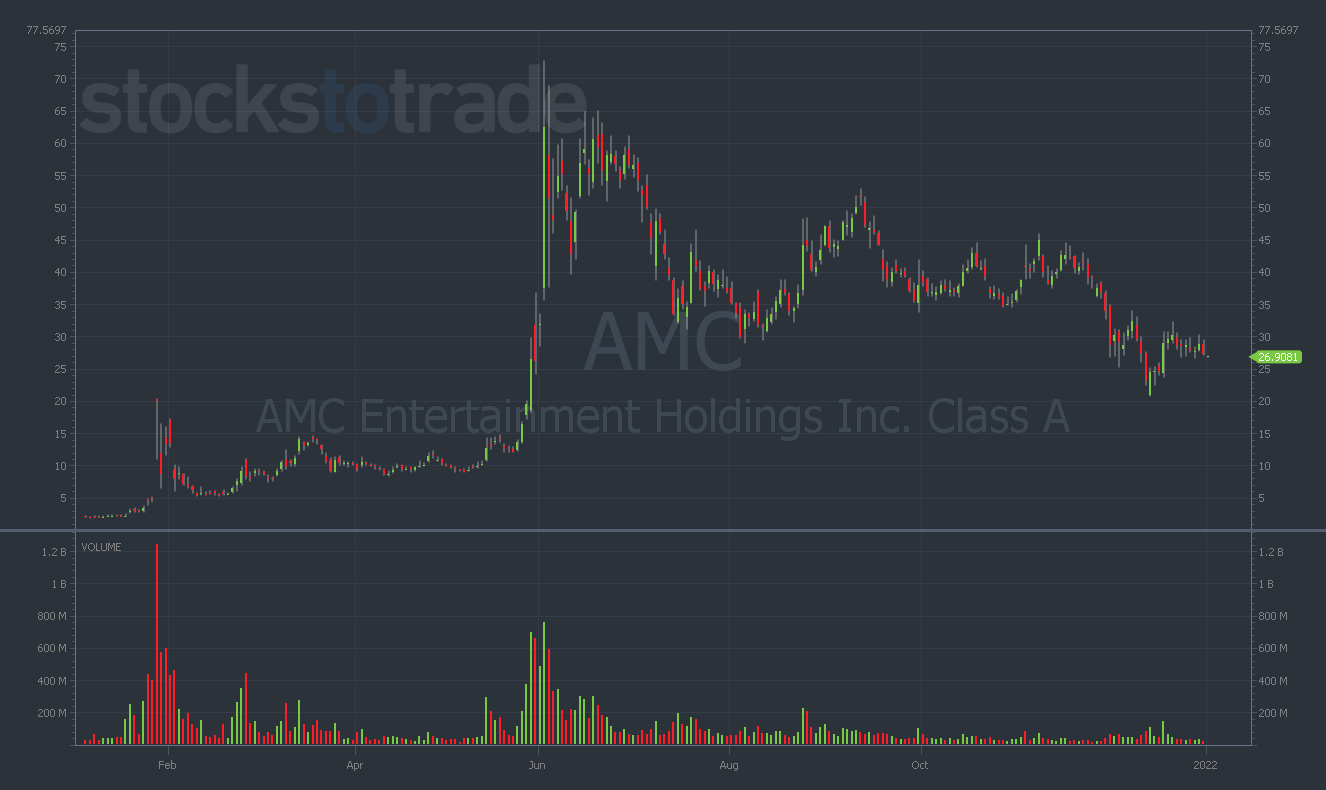
AMC 1-year daily chart — courtesy of StocksToTrade.com
Legendary meme stock AMC is another chart I’ll be watching closely in 2022. And like many of the other stocks I’ve mentioned, there’s a specific price level I’m focusing on — $27.
For two weeks straight, AMC has traded tightly right around the $27 level.
While I’m neutral on some of these other charts, I’m bearish on AMC. I think it could unravel another 10% or so. But again, I’m waiting for the perfect moment to strike.
I want to see a clear indication of near-term price direction (and further deterioration of retail trader sentiment) before attempting to buy puts on AMC.
Notice the pattern in the stocks I’ve mentioned today. They’re all wildly volatile momentum stocks that are now stuck trading in narrow ranges.
With stocks as popular as these, sustained range-bound trading doesn’t usually last long.
In other words, a big dump or surge could be right around the corner in any of these charts.
When it comes to AMC, nothing can be certain. But I sense that the retail support is dwindling quickly. Traders are losing patience, and I think it’s only a matter of time before the chart breaks lower.
But just like these other setups, I’m not ready to trade AMC puts just yet. I’ll be eyeing the $27 level like a hawk — and monitoring the options chain for any obvious indicators.
Conclusion
Although it’s a brand-new year, my fundamental trading strategy isn’t changing at all. Heck, even the charts I’m watching are mostly the same!
But there’s a reason for this. I’m familiar with these charts and I’ve successfully traded all of them in the past. (If it ain’t broke, don’t fix it!)
Don’t just take it from me. Do yourself a favor — find the charts that speak to you and bookmark them for the year to come.
