- Why key price levels matter SO MUCH to me (and how I use them to my advantage)…
- The thought process behind my recent trades where critical levels were my guides…
- Plus, has Sykes gone INSANE with this offer? Don’t miss your chance to grab the ULTIMATE trading education with off-the-charts savings!
As traders, we have to look at ourselves as snipers. Tim Sykes has taught this over and over.
When a volatile stock has a red first red day — or a break of multi-day, multi-week, or even multi-month support — that’s the ideal time to buy puts. The risk/reward on these trades is fantastic.
But how exactly can you nail these types of trades? By recognizing key price levels, you can take advantage when they start to crack.
With that in mind, let’s talk about some of my recent trades where I used important price levels as my sniper targets…
AMC Entertainment Holdings Inc. (NYSE: AMC)

(AMC 1-month daily chart — courtesy of StocksToTrade.com)
First, we’ll talk about meme stock favorite AMC. I was trading this on December 23. This stock was already crushed quite a bit, but it bounced.
Notice anything? That’s right. This was the first red day. So naturally, this was the day when I was aggressively buying puts. Ultimately, the chart got destroyed…
I was interested in shorting AMC into this bounce from $21 to $32.
I was watching two key levels in AMC. First, the $30 level, where AMC had failed several times before.
The first red day saw AMC slice through $30 like nothing even happened.
After the first red day dropped the stock to $27, it closed strong and rallied over the next few days.
But I was fine with this. Now, I had a new key level to focus on — $27. That level broke before too long as well.
The break at $27 — a key level of multi-day support — was a great opportunity to play AMC puts. Shortly thereafter, it dropped all the way to $23!

(AMC 5-minute chart from December 23 — courtesy of StocksToTrade.com)
Big picture: AMC is a bag-holder chart. The dead pump bounces tend to work well on stocks like AMC that are seriously beaten down.
Pfizer Inc. (NYSE: PFE)
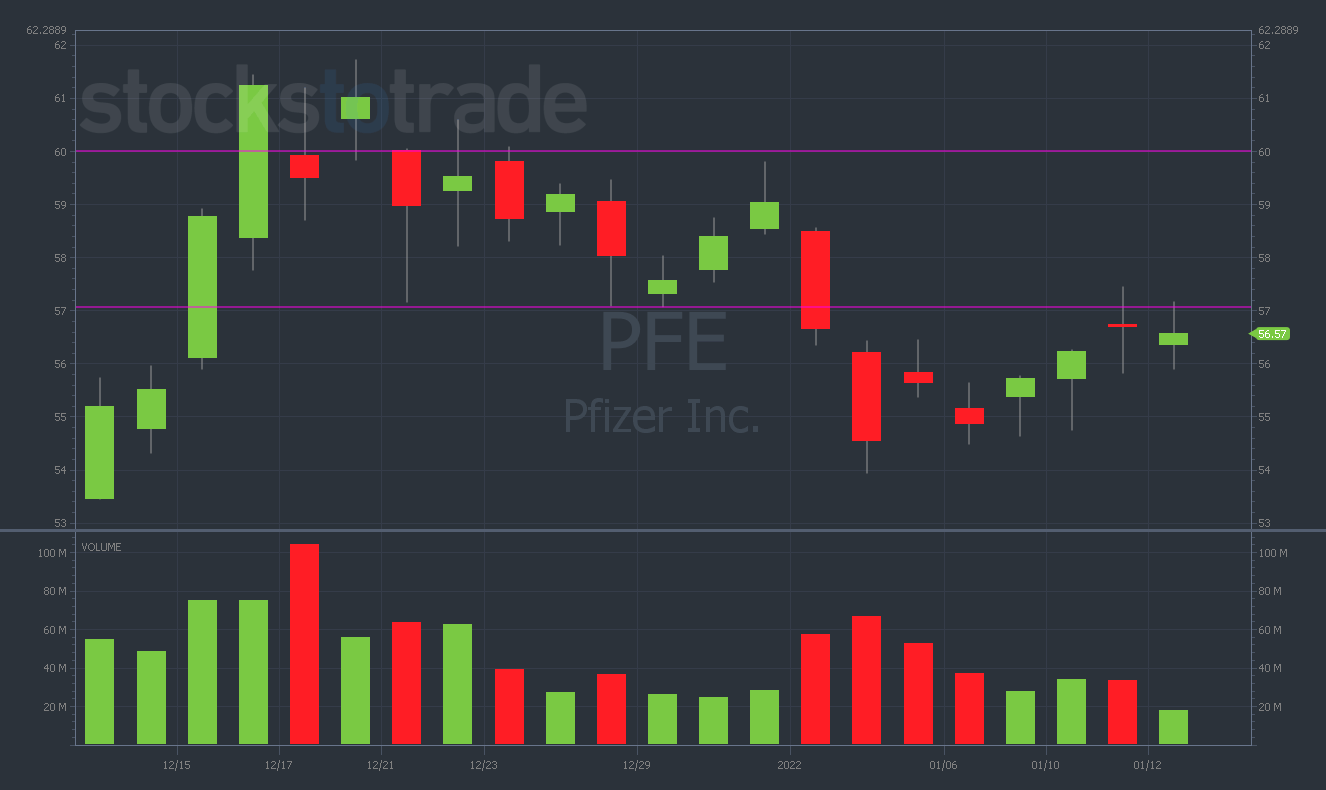
(PFE 1-month daily chart — courtesy of StocksToTrade.com)
Next up, we’ve got the vaccine king — PFE. I was trading puts on this when it was struggling at $60 (also on December 23).
Big picture: PFE had come up from $50 all the way to $61, which is a pretty big move for Pfizer. It usually doesn’t have a huge amount of volatility.
If you look at the 5-minute chart below, you can see it already had the big drop after failing to crack $60. That was your signal.
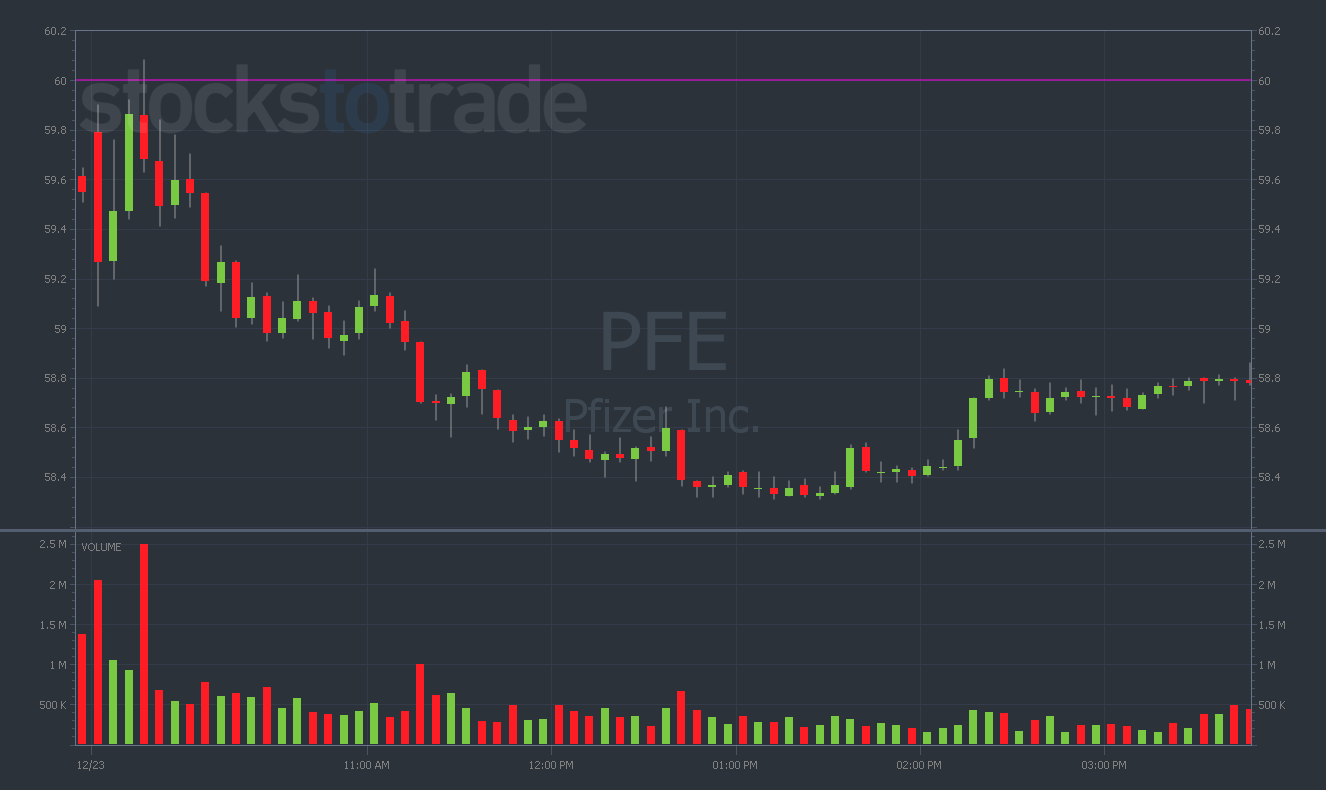
(PFE 5-minute chart from December 23 — courtesy of StocksToTrade.com)
This big drop was your cue that $60 was a huge level of resistance.
My point? When PFE came back up to $60, that was an ideal spot to buy some puts.
Sure, it would’ve taken some patience. But ultimately, PFE dropped to a support level of $57 over the next few trading days.
Note: This could’ve been a massive win for anyone who was zeroed in on the critical price levels!
Why can’t trader and mentor Tim Bohen stop laughing?
He keeps “owning the hedgies” with this incredible strategy. (And he thinks it’s hilarious!)
To see how this could radically boost your trading, starting tomorrow…
Then, notice what happened next. PFE had another bounce to $59.60 — just under the $60 resistance. When it failed to break $60 yet again, another big drop occurred…
The lesson? You need to be patient and let the charts play out — then use the key price levels to trade accordingly.
Tesla Inc. (NASDAQ: TSLA)

(TSLA 1-month daily chart — courtesy of StocksToTrade.com)
On December 28, I traded TSLA again. This time, I was buying the $1,050 strike puts.
I was looking to short the same kind of pattern as PFE. You can see it in the chart…
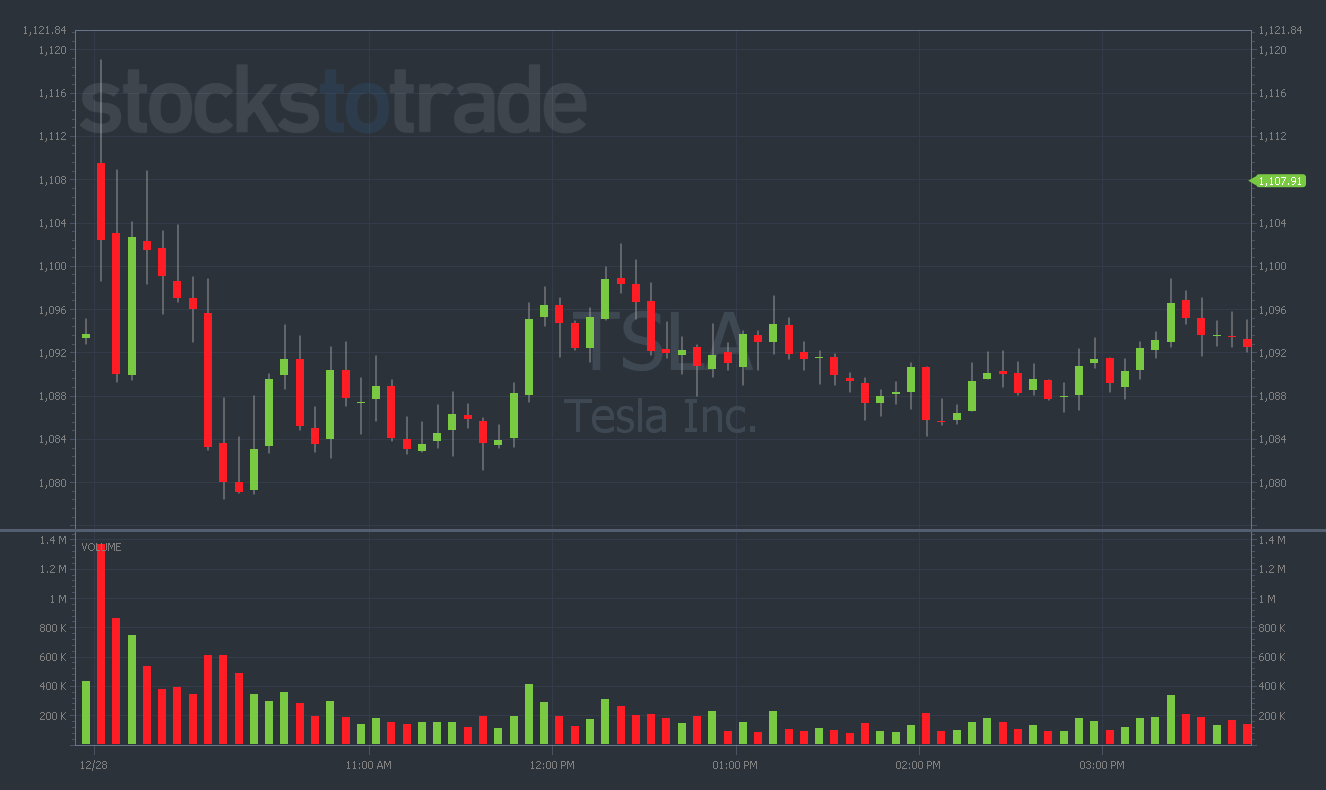
(TSLA 5-minute chart from December 28 — courtesy of StocksToTrade.com)
I thought that the sideways price action would lead to more fading. Of course, right after I bought puts, TSLA announced record EV delivery numbers.
The stock went to $1,200 on the news. At this point, I was even more intrigued, as $1,200 has been a consistent topping level on the TSLA chart.
Note: If you’re gonna get aggressive and attempt a TSLA short, do it near the $1,200 level. This level’s been the fail point in the chart every single time.
I was trading TSLA at the mid-range of the move, and it didn’t ever drop below $1,050.
I was mostly on the right track — I just didn’t realize there was positive news coming down the pipe.
The lesson? You must be aware of these key price levels — and constantly pay attention to the news.
Nvidia Corporation (NASDAQ: NVDA)
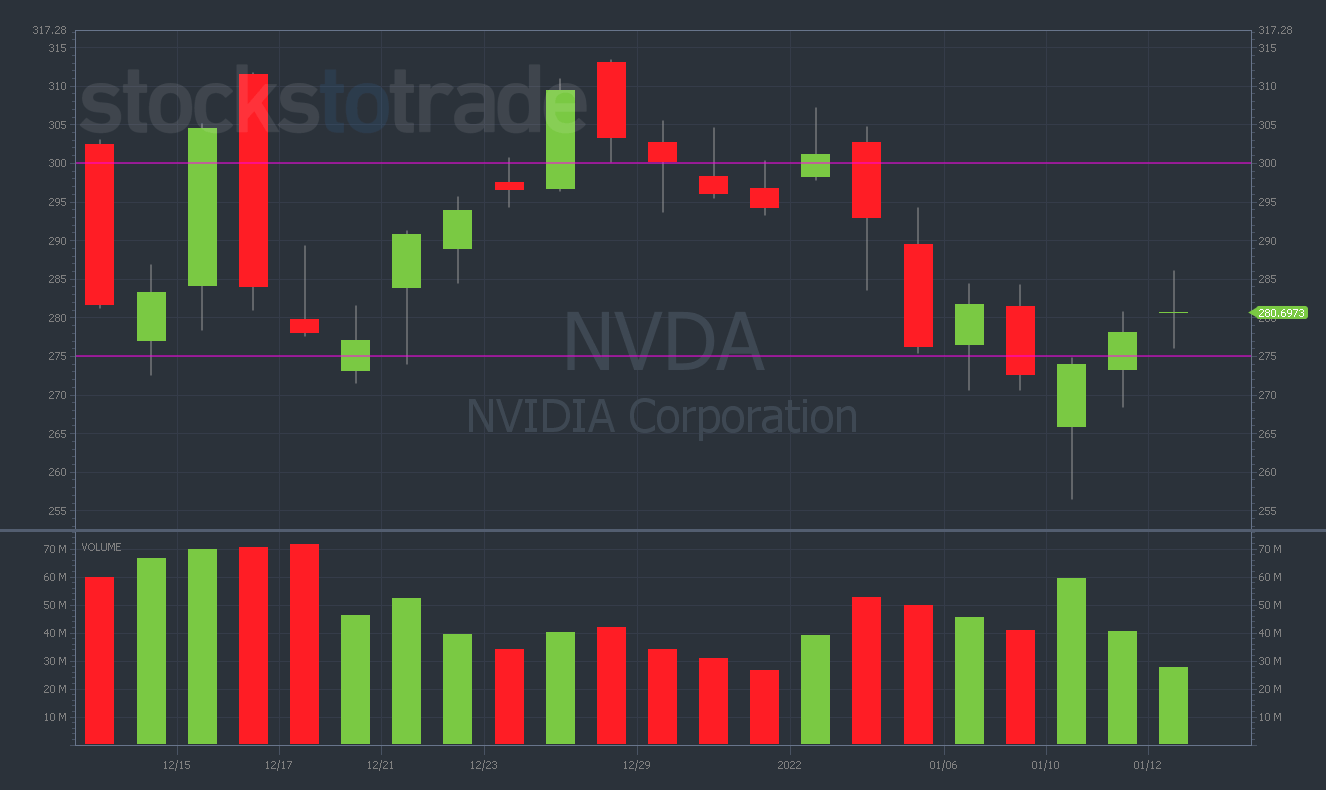
(NVDA 1-month daily chart — courtesy of StocksToTrade.com)
The last chart we’ll look at is NVDA. Here, we’ve been seeing sideways price action — the same kind of chart as TSLA.
On January 4, I was buying the $285 puts, looking to take advantage of the bounce and go short.
I noticed some support near $275, so the $285 strike provided the perfect risk/reward for me.
NVDA had a big bounce off the lows. I was on the right track but ended up selling these puts for a loss.
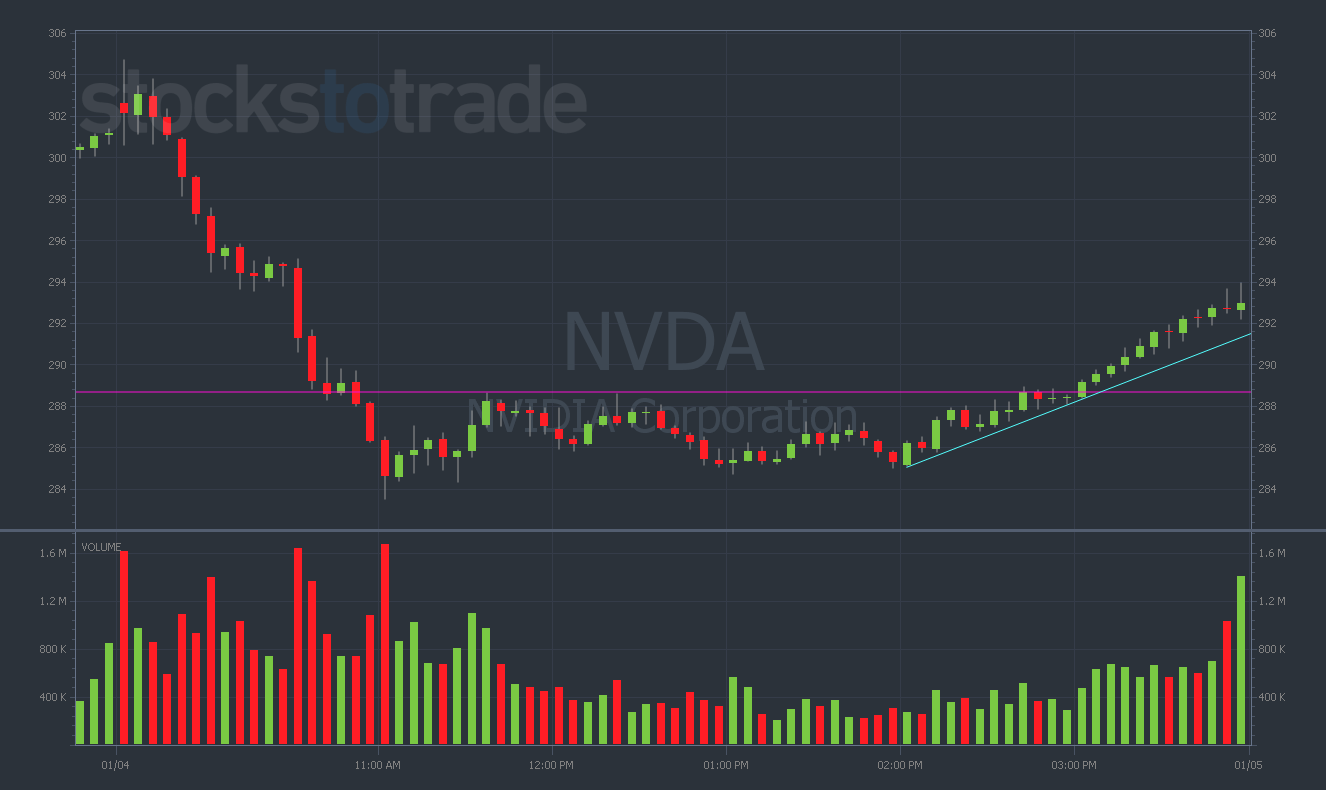
(NVDA 5-minute chart from January 4 — courtesy of StocksToTrade.com)
Regardless, there are some important lessons to pull from this trade as it relates to key levels.
Where was the resistance here? In the big picture, it’s been at $300.
Remember: Big round numbers often lead to major resistance.
NVDA once again failed in that area. But keep in mind that the whole market was dropping with it.
If there’s overall market weakness, it’s good to get a little bit more aggressive on the put side. The general momentum is in your favor — harness it to your benefit.
Note: It’s so good to be short into a big crack of sideways price action!
Conclusion
That’s it, Evolvers! Nothing too complicated. This is how you identify the key levels.
Respect the price levels — then aggressively take your positions when the trade comes.
That being said, when I alert some of these plays, I see huge volume coming through (and people going too crazy chasing the alerts).
I hope that by continuing to do these lessons I can help you all become 100% self-sufficient traders.
