As a trader, you’ve gotta pounce on the great setups when they show up on your watchlist. Tim Sykes has taught this over and over.
When a volatile stock has a red first red day — or a break of multi-day, multi-week, or even multi-month support — that’s the ideal time to buy puts.
If you can nail your timing, the risk/reward on these trades is fantastic.
You can take advantage (and potentially make a ton of money) by recognizing when key price levels start to crack.
I’ve made nearly $4 million in the stock market and a huge chunk of that came from my ability to recognize key price levels and act on my conviction.
On that topic, I don’t know anyone better at teaching others how to win in the stock market than Tim Sykes.
And right now, Sykes is running his 46-Day Account Accelerator, where he’ll show students how they can potentially turn $1,000 into $10,000 in just 46 days. Sykes has only done this once before and now it’s finally happening AGAIN! Click here to see all the details.
Now that you’re signed up, let’s get back to price levels…
How do I know which levels (and ranges) are critical to watch? And how can YOU learn to see them yourself?
With these questions in mind, I’d like to focus on price levels today. Keep reading and I’ll show you the three factors I look for when picking key levels…
See Where the Chart Has Failed (or Bounced) Previously
I’ve said it before and I’ll say it again … In the stock market, you’ve gotta know your history.
And this is just as true when it comes to knowing the history of charts as when it comes to headlines, events, and macroeconomic data.
The Next 46 Days Can Put Your Account on the Fast Track

With many stocks crashing left and right, many people are having a difficult time growing their trading accounts right now.
But this coming Thursday July 28th at 8 p.m. ET…
Tim Sykes will reveal a strategy that’s so powerful he believes traders have the potential to grow a $1,000 account into a $10,000 account in just the next 46 days!
When I’m trying to determine key price levels, the first thing I’ll do is zoom out on a daily or weekly chart and see where the stock has continually failed (or bounced).
If the chart bounces at the same price over and over again, that’s a level of historical support.
If the chart fails at the same price over and over again, that’s a level of historical resistance.
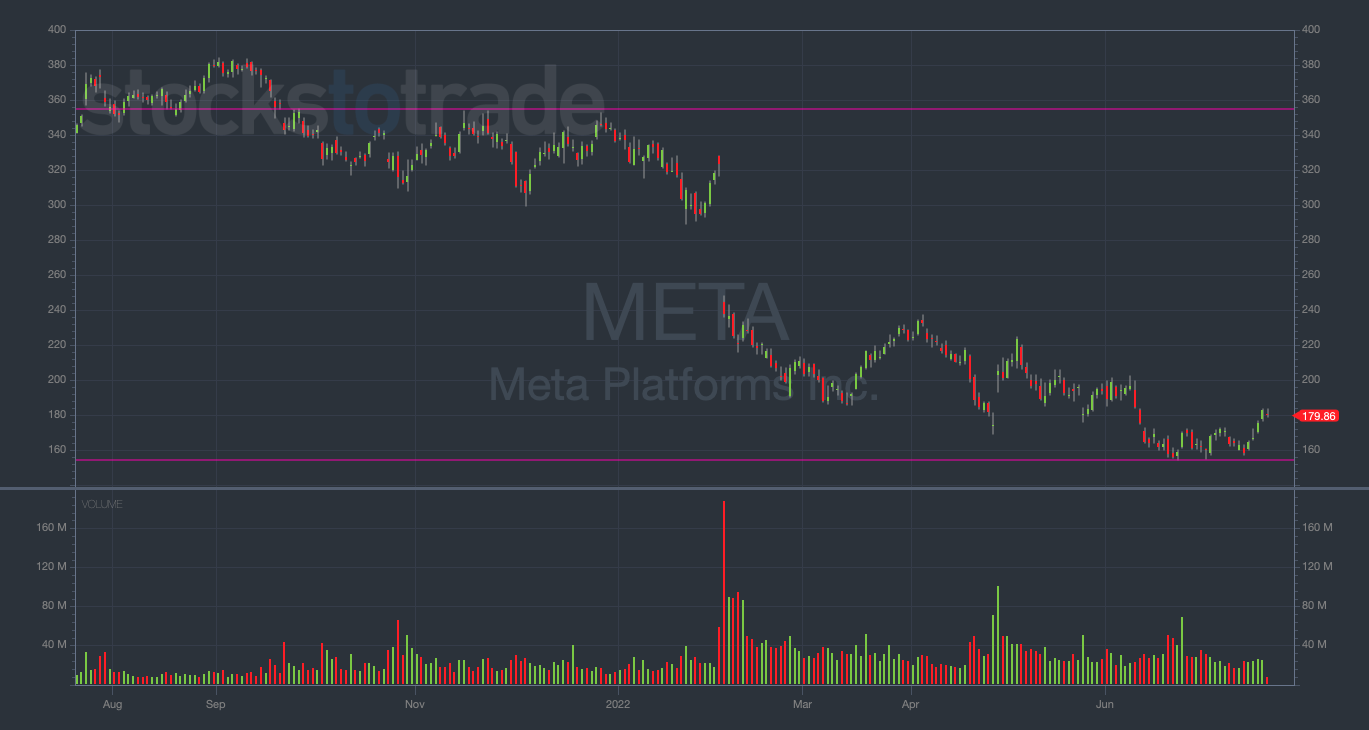
For example, take a look at the daily chart for Meta Platforms Inc. (NASDAQ: META)…
META 1-year daily chart — courtesy of StocksToTrade.com
In November $221, META struggled to trade above $360. It backed off around $356 on three separate days.
I immediately marked this as a level of resistance.
On the other hand, after META lost $250 billion of its market cap in a single day in February, I was watching for where the stock would bottom out and create support.
Ultimately, it wasn’t until META traded down closer to $150 that it found strong support.
I’ve drawn purple lines on the chart so you can see these levels.
With a bit of experience, you won’t need the lines drawn in. You’ll be able to see the key levels by yourself immediately upon viewing a chart.
Psychological Price Levels and Big Round Numbers
As I explained above in regards to META, most charts have their own specific support and resistance zones.
However, there are also some common levels of psychological resistance that can occur within a chart.
Oftentimes, these levels coincide with big round numbers like $20, $50, $100, $200, etc.
Growing A Small Trading Account? Check this Out
When multi-millionaire trader Mark Croock first started trading, he was an overworked and underpaid accountant…
So he knows what it’s like to start small while wanting to massively grow your wealth as quickly as possible.
That’s why he just recorded a step-by-step training that reveals what he believes is the best options trading method for someone trading with a small account.
And if you think about this logically, it makes a lot of sense.
Traders are watching the same levels and setting limit orders around them, causing big bounces (or dumps) to happen when the share price nears that level.
It’s not hard to believe that many traders around the world might want to sell a stock that’s been running once it hits a number like $100.
But once they all start selling, it creates a resistance level for the stock. Then, the next time the share price gets close, traders will be on high alert, creating a double-whammy effect.
This works the same way on the low end of the chart.
Traders will set limit buy orders when they feel the stock is getting too cheap. And if enough traders do this near the same level, it can cause a massive bounce and form a level of support.
All this to say, pay attention (and be cautious) when a chart you’re watching nears a big round number.
Final Thoughts
That’s it, Evolvers! Nothing too complicated.
These are just a few ways you can look to identify key levels. Other methods may work for you, but these are the methods that work for me.
Respect the price levels — then aggressively take your positions when the trade comes.


