Happy Friday, Evolvers!
This needs your attention…
Nearly every question I got this week was about one stock…
You guessed it — I’m talking about Nvidia Corporation (NASDAQ: NVDA) earnings.
But the aftermath of this setup probably isn’t what you expected. And it’s an excellent lesson about one of the most important factors of options trading.
HINT: If you trade options like stocks, you’re setting yourself up for failure!
So, in today’s Q&A, I’ll break down everything you need to know about the follow-up to NVDA’s earnings report.
Keep reading and I’ll answer your questions…
“Why were the NVDA 8/25 Calls down yesterday when the stock was up 3%+?”
Listen…
You’re about to learn a critically important lesson about options, and, in particular, trading options around earnings reports…
For options traders, the biggest obstacle to overcome during earnings season is higher-priced contracts due to elevated implied volatility (IV).
And it sounds like you’re overlooking how much IV crush can affect options contracts following the release of an earnings report.
Let’s look at NVDA specifically…
Going into Wednesday afternoon’s earnings print, the “implied move” for the underlying stock was 10%.
That means the options were priced in such a way that, in order for you to profit, NVDA stock would’ve had to gain at least 10% on Thursday.
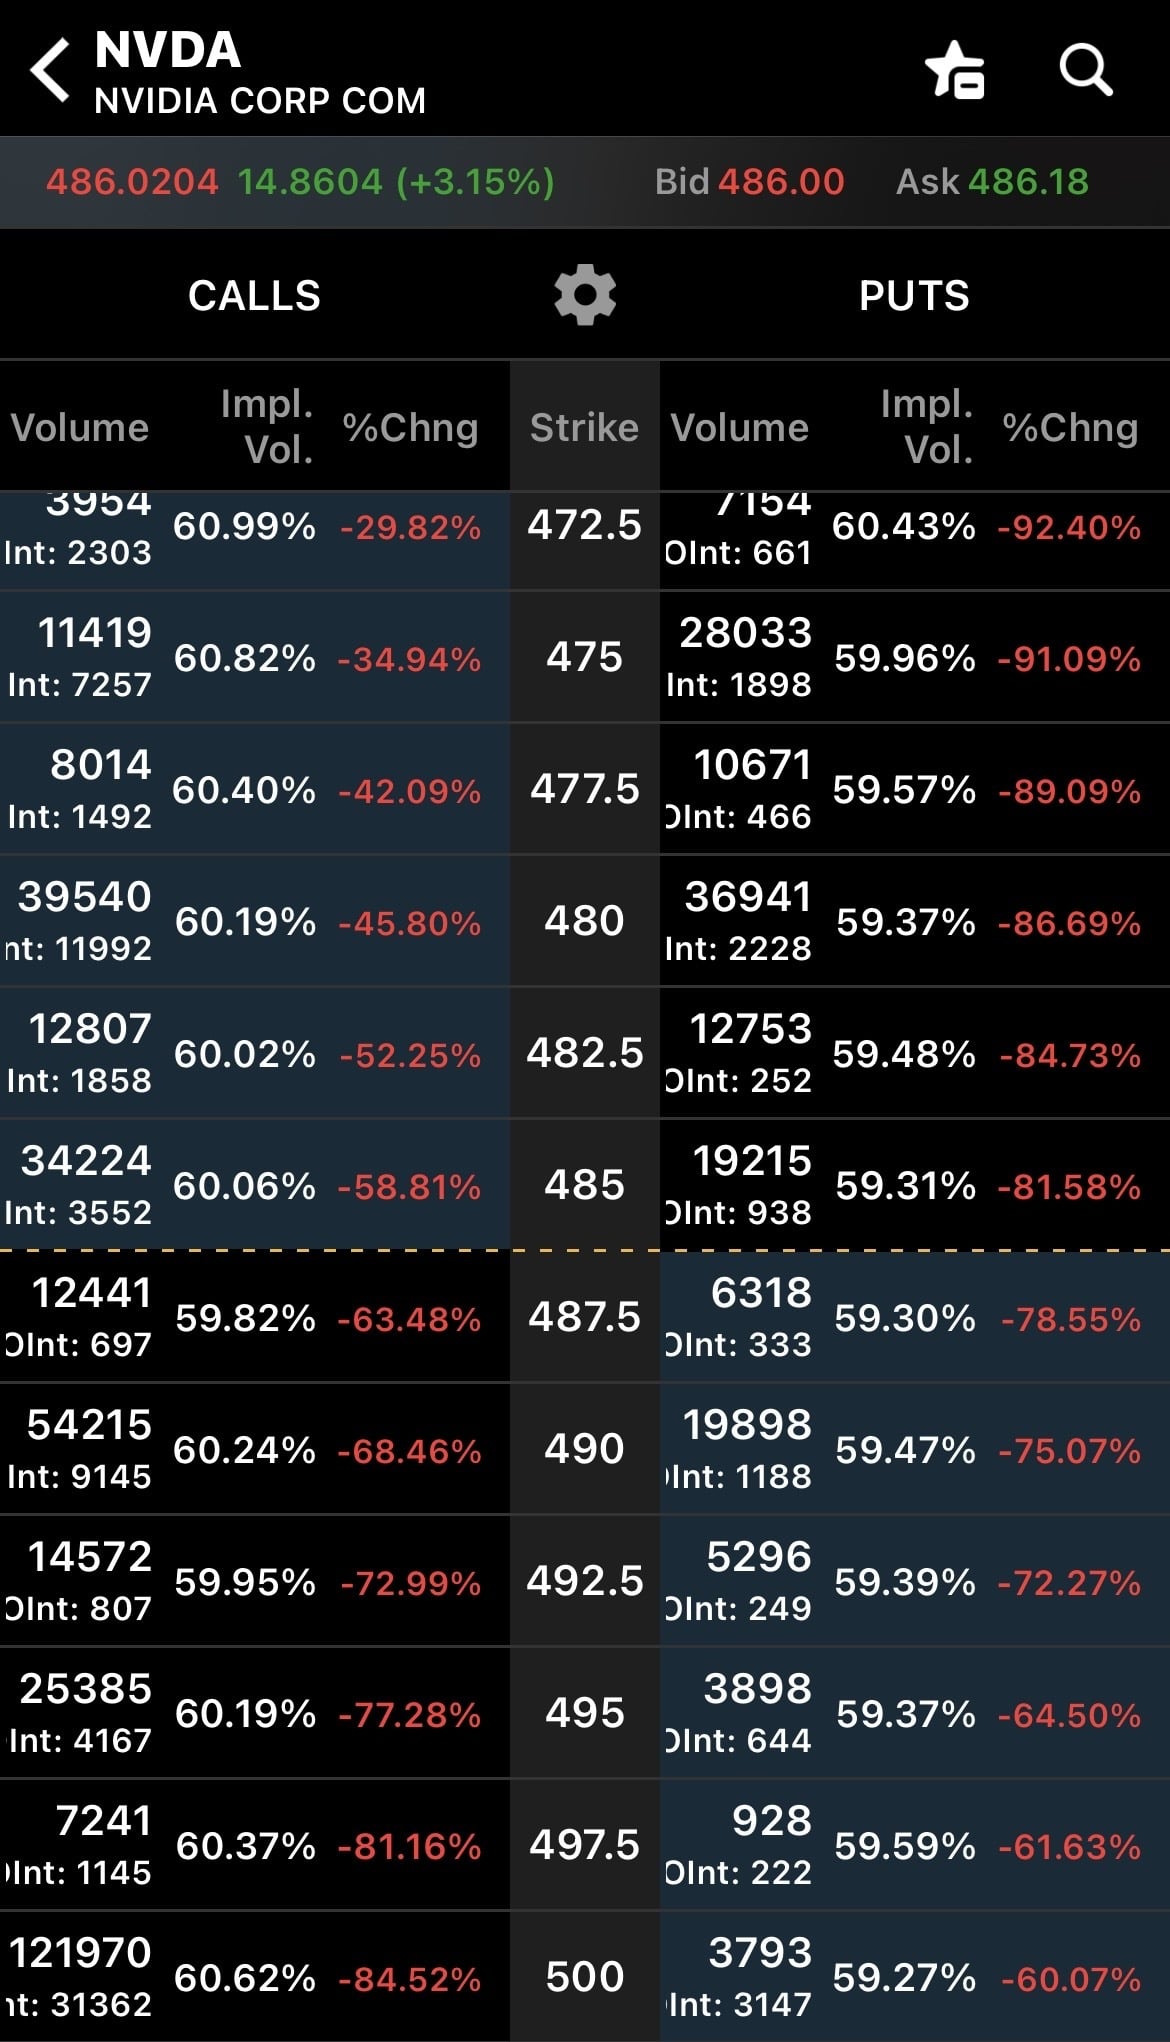
But NVDA was only up 3% on Thursday. This caused a huge IV crush across both weekly puts and calls…
Just look at the absolute carnage on both sides of the options chain…

NVDA 08/25/2023 Options Chain — ThinkorSwim
I often find that earnings winners don’t move enough, especially for the higher-priced stocks.
Even if a company has solid earnings, the high IV (and expensive premium) makes it difficult to lock in the kind of gains I’m looking for.
Increased liquidity, retail trading, and volatility all factor into how options are priced for an earnings report.
This leads to earnings trades being skewed toward risk over reward.
REMEMBER: If you’re buying options before an earning report, you’re not trading … you’re gambling. It’s a guessing game, no different than sports betting because anything can happen on any given day.
Now, this doesn’t mean you can’t craft any trades based on earnings reports.
It’s just about how you time it…
I’ve said it before and I’ll say it again. It’s best to wait until after the earnings report is released, then trade the market reaction.
This leads me to your next question…
“Can you explain your trade thesis behind buying NVDA puts yesterday?”
This one’s pretty simple. Let’s look at the big picture…
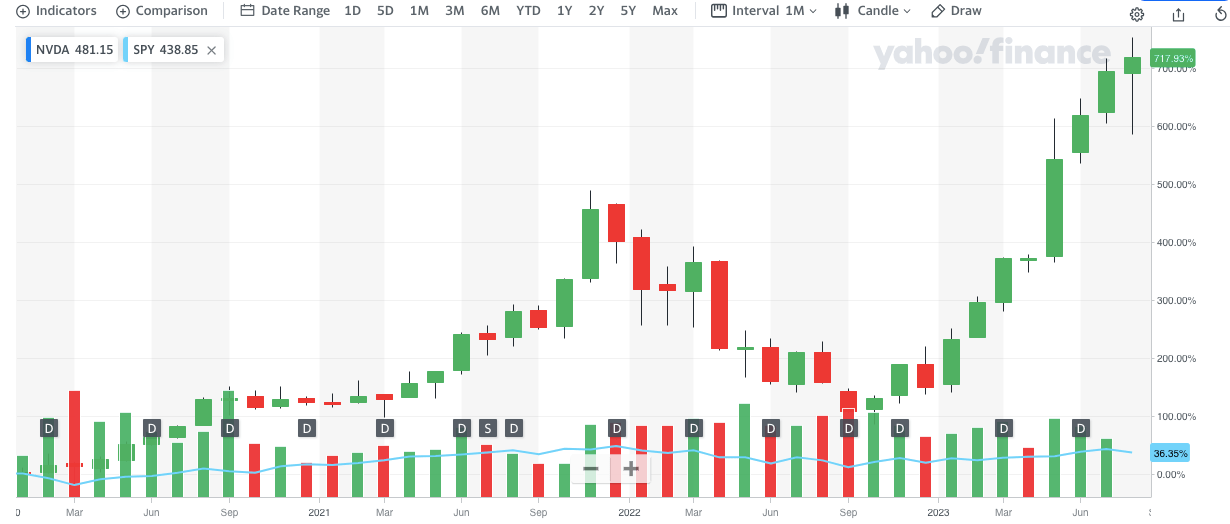
NVDA is now up 237% YTD, booking eight green months in a row…
NVDA 3-year monthly chart — Yahoofinance.com
Think about that…
NVDA hasn’t had a single red month in 2023. This is unsustainable.
So, I think it’s overdue for its first red month.
But why now?
During NVDA’s May earnings report, when the stock surged 20%+ in a day, the chart was already overextended.
But at the time, the momentum was too strong to short…
Now, NVDA is trading 80% higher than May. But after this recent earnings report, the stock was only up 3%.
This tells me that traders are much less enthusiastic about buying NVDA at $500 than they were about buying it at $385.
(I don’t blame them…)
Plus, once again, we see a chart start to wane when it gets near a big round number — $500 on NVDA.
All of these factors lead me to believe the NVDA euphoria is running out of steam.
I think the $500 area could prove to be a brick wall of resistance and the ultimate top for this momentum run.
That said, I’m giving myself some time on this trade. Three weeks, to be exact…
Yesterday, I bought NVDA 09/15/2023 $450 Puts for $8.40.
I think NVDA trading as low as $400-$420 in September is very possible.
Of course, there are no guarantees in the options market. I can only make plays based on the technical indicators I’m seeing.
With that in mind, here are the three key indicators that give me confidence in my NVDA puts position:
- The stock is up a huge amount in a short period. (NVDA is up 16% in the past week and 106% in the past six months.)
- Rising price, flat volume. (NVDA’s share price has risen, but the daily trading volume isn’t soaring. This combination is often a bearish indicator.)
- The price action is failing to crack a crucial round-number resistance level. (The $500 level briefly cracked in after hours on Wednesday, but the stock quickly traded back below it on Thursday morning. If NVDA can’t run beyond $500 soon, that level is going to be a hard resistance wall to break.)
Now, I want to bring your attention to a very exciting event coming up…
The Rogue Trading Summit
On Thursday, August 31st at 8 pm Eastern, Tim Sykes is going to sit down with one of the biggest hedge fund legends of our time … Jeff Zananiri.
During this exclusive interview, Jeff will blow the lid off a phenomenon that his hedge fund, Pan Capital, used to turn $5.1 million into over $700 million and go 10 straight years without a single losing quarter.
I mean … are you kidding me?! These results are INSANE.
It’s not every day you get the opportunity to hear the whole truth from a trusted source — a seasoned veteran, like Jeff, with years of experience in the trenches of Wall Street…
Please Remember: Due to the controversial nature of what Jeff will be sharing, this private broadcast is limited…
So, it’s vitally important to immediately claim your seat to Tim and Jeff’s big reveal.
What are you waiting for?!
Click here NOW to RESERVE YOUR SPOT for the Rogue Trading Summit!


