Here’s the truth, Evolvers…
Right now, every trader on the planet is watching the same chart, the same trendlines, and the same price action.
Of course, I’m talking about the S&P 500 ETF Trust (NYSEARCA: SPY).
I’ve been discussing the SPY all year (and for good reason)…
The SPY is the biggest ETF in the world and, therefore, it’s the chart that traders watch more than any other.
But in 2022, as the SPY has entered a bear market, it’s become even more important to pay attention to.
The technical moves in the SPY — like confirmations or rejections at key price levels — have foreshadowed the moves in individual stocks all throughout this year.
If you know what to look for and work hard on your technical analysis, the SPY chart can be incredibly helpful in determining the near-term direction of the overall market.
(WARNING: If you sleep on these indicators … you could potentially miss a massive trade, or worse, take a big loss!)
And right now, one particular chart pattern on the SPY is impossible to ignore.
So, keep reading and I’ll show you the crucial indicator I’m watching on the SPY chart…
The SPY’s Falling Wedge
The SPY is down 15.9% YTD (at the time I’m writing).
But this has been a slow, orderly drawdown … totally different from the sharp pandemic crash in March 2020.
Looking at the SPY’s long-term daily chart, the falling wedge pattern isn’t difficult to see…
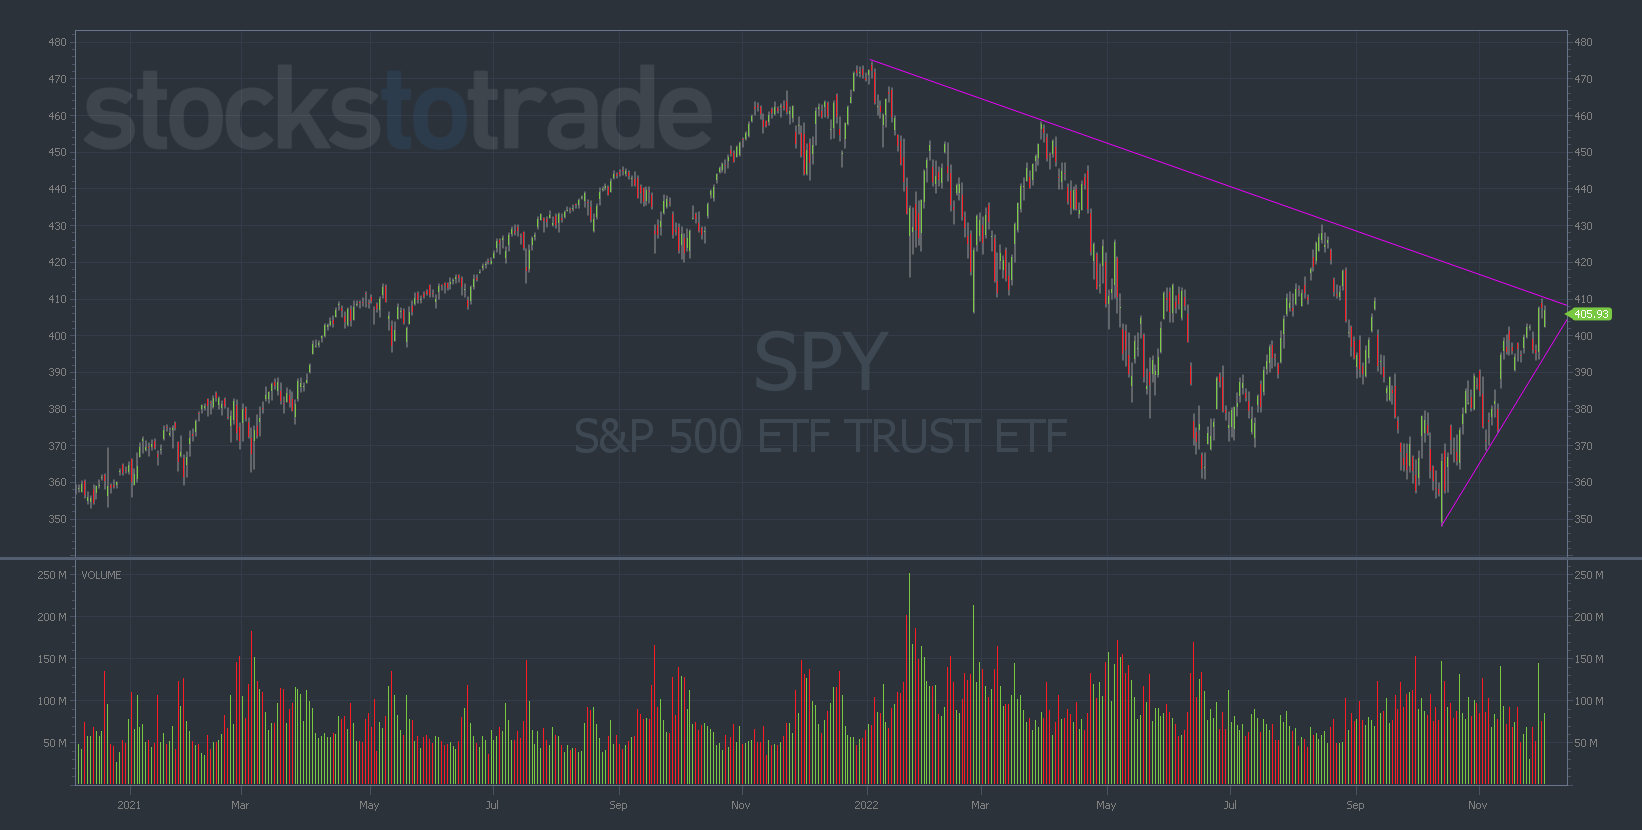
SPY 2-year daily chart — courtesy of StocksToTrade.com
After hitting the October lows at $348, the index has been trading back up toward the primary downtrend.
Notice what happened as soon as the SPY tested its trendline on Thursday, December 1…
It once again got rejected.
We’ve now seen four clear tests of this trendline since the bear market began last November…
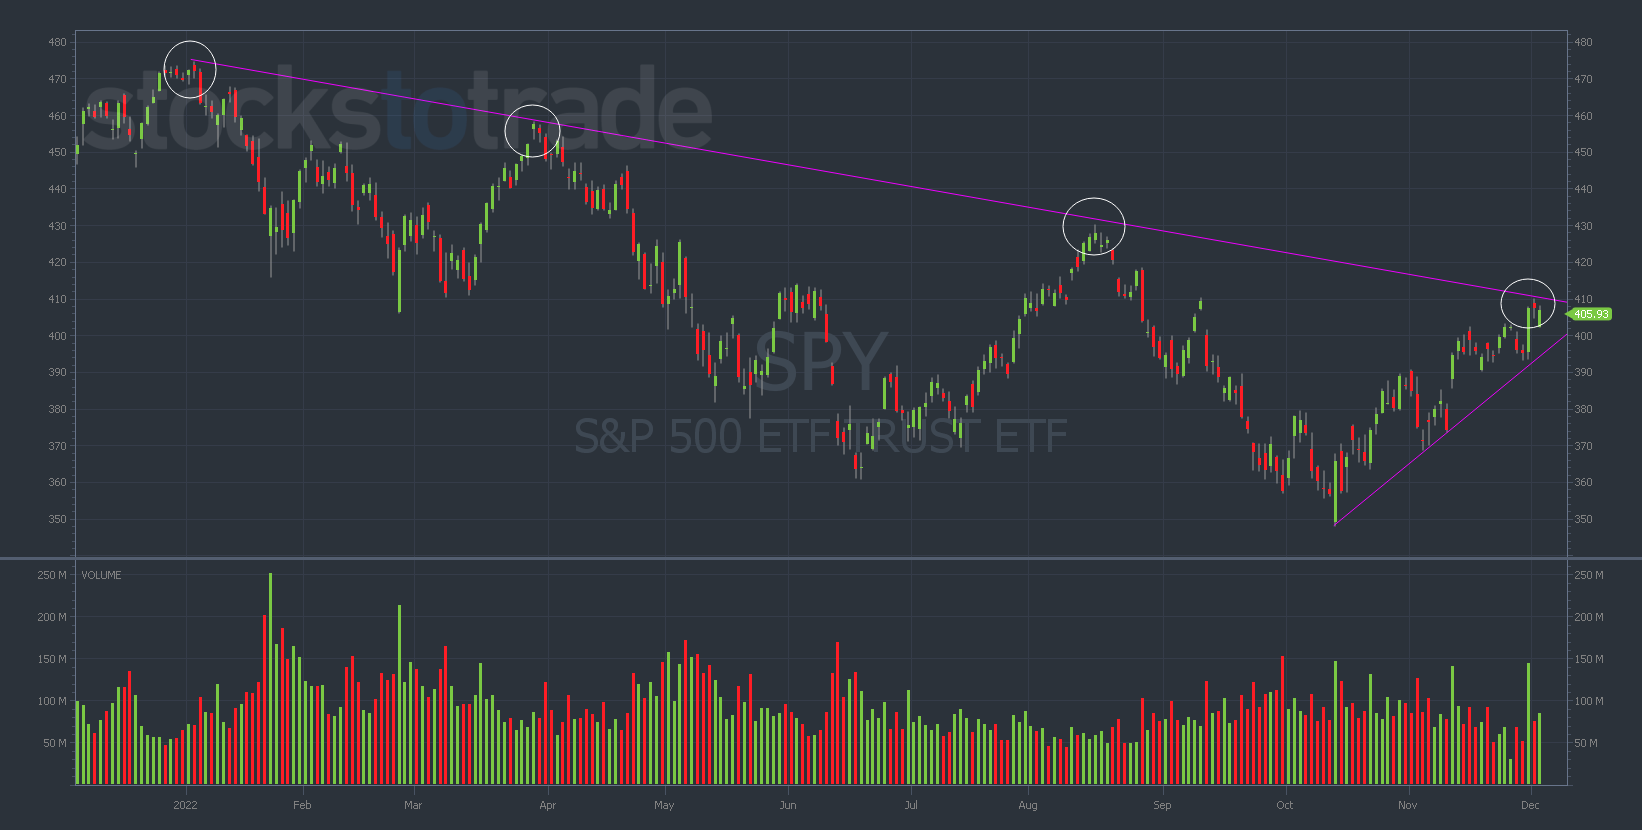
SPY 1-year daily chart — courtesy of StocksToTrade.com
But towards the end (or cone) of a wedge pattern, the trading ranges tend to tighten up considerably.
And that’s exactly why the SPY has been so choppy over the last several weeks.
From a technical standpoint, this is a critical crossroads for the SPY…
As we get tighter and tighter into the cone of this wedge pattern, sideways price action becomes less sustainable.
In other words, there’s likely to be an explosive move one way or the other.
I see two distinct possibilities:
- The SPY breaks out of the downtrend and makes a move higher into year-end. This would track with the ‘Santa Claus rally’ that often occurs in late December.
- The SPY’s rejection last Thursday was just the beginning and we see a big move lower following the overall downtrend.
Meanwhile, there’s another technical indicator to pay attention to…
The VIX Near Lows
The CBOE Market Volatility Index (VIX) is one of the most widely-tracked funds in the market.
It attempts to gauge the overall level of fear in the market by combining the weighted prices of the SPY’s put and call options for the next 30 days.
The VIX and the SPY are closely linked, but their relationship is inverse. When the SPY goes up, the VIX goes down (and vice versa).
Throughout 2022, the VIX has been an accurate prediction engine for the SPY.
Every time the VIX has traded near $20 the SPY has hit a near-term top. (See the chart below…)
https://twitter.com/helmigka/status/1599603036581933056/photo/1
So, as the VIX forms a triple bottom, you should be cautious about the possibility of some selling pressure coming in here.
That said, this bear market rally is strong and the uptrend of the wedge hasn’t broken yet. Until it does, I’m not fighting the trend.
Final Thoughts
We’re getting extremely close to a critical point for the SPY.
I’m expecting muted price action this week as traders prepare for next week (when the Fed meeting takes place and a new interest rate decision is announced).
The timing of the Fed meeting and the end of the SPY’s falling wedge pattern are coinciding perfectly.
Take this week to study the charts and prepare your game plan. And expect fireworks next week.
