No … I wasn’t trading off inside information.
No … I wasn’t pumping small-cap stocks.
And no … I didn’t get lucky off one play.
I was able to take such a small amount of money and turn it into something substantial because I used leverage.
That’s right … I utilized the power of options.
But for some, the options world is mystifying.
Maybe you’ve stared at an options chain — trying to make sense of all the numbers — and found yourself completely confused…
Volume? Open interest? Bid-ask spread? What’s the difference?
Anyone who’s ever looked at an options chain has seen these metrics.
And while they may come across intimidating at first glance — they unlock a significant amount of information for me as a trader.
I even utilize these three metrics to make key decisions, like which contracts and strike price I should trade.
Let’s break it down…
Volume
Volume is a running total of the number of contracts traded on a particular contract on a given trading day.
Think of volume as a short-term liquidity indicator — it helps to see the flow of contracts on a near-term basis.
For day traders of options (like me) volume is probably the most useful liquidity figure. It reveals the immediate order flow happening that day.
If a big news headline causes large-scale buys in a particular weekly contract, the volume on that contract will stick out like a sore thumb.
If you know what to look for, it isn’t hard to spot. And following the ‘smart money’ can potentially work in options trading — but both how and when are essential.
This is why we always see the financial news media obsessing over ‘unusual options volume.’
In reality, sometimes it is — and sometimes it isn’t. There are no guarantees in the options market.
While options volume can be a helpful indicator, you should never enter a trade just because you see a lot of volume on the contracts.
Open Interest (OI)
If volume measures short-term liquidity, then open interest (OI) is its long-term counterpart.
OI measures the total number of contracts held in open positions on a particular strike price.
Where volume counts the contracts traded that day, OI calculates all of the contracts sitting in traders’ accounts, including those that aren’t actively being traded.
Think about it … If you swing trade options, those contracts will be idle in your account for however long you’re in the trade.
Other traders should have the ability to see that those contracts exist. Additionally, they need to differentiate between them and actively traded calls and puts.
This is why volume and OI are calculated separately.
And as someone who enters trades with a variety of different time frames, I’m thankful that they are.
The Bid-Ask Spread
At the end of the day, volume and OI are used to track the liquidity of options contracts.
Why do we care about liquidity so much? Because if there’s no liquidity, the bid-ask spread will be so large that the contracts will be untradeable.
First, let’s look at an example of a very liquid options chain (the kind of contracts you want to trade). Here’s the 2/11/2022 weekly options chain for Apple Inc. (NASDAQ: AAPL):
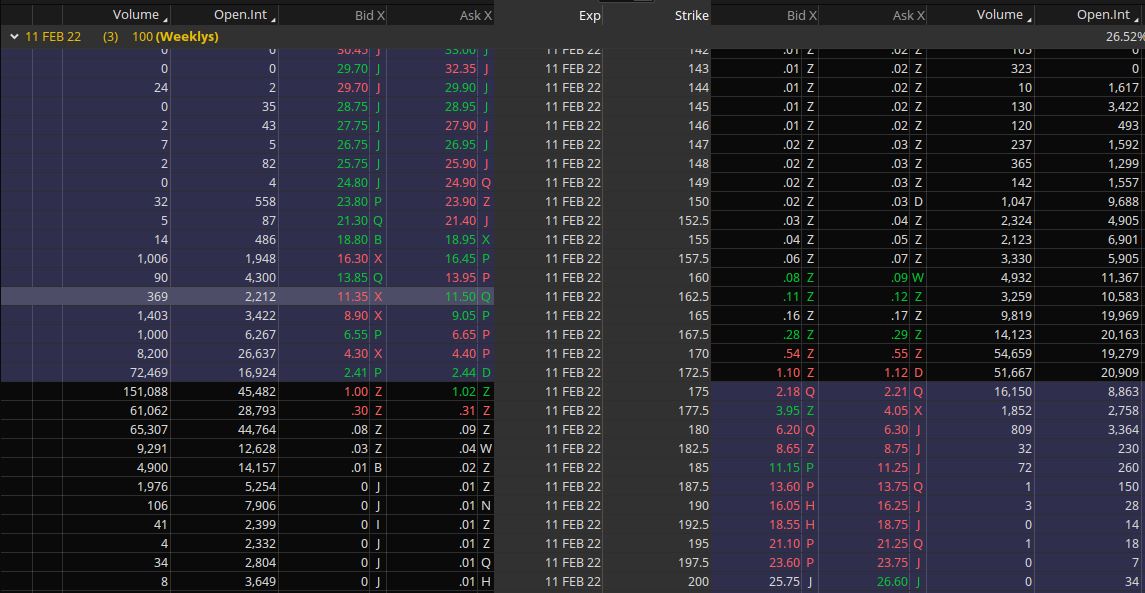
Notice that the volume and OI are massive, which leads to a very small bid-ask spread. This is what you want.
In contrast, look at the same weekly options chain for Stem Inc. (NYSE: STEM):
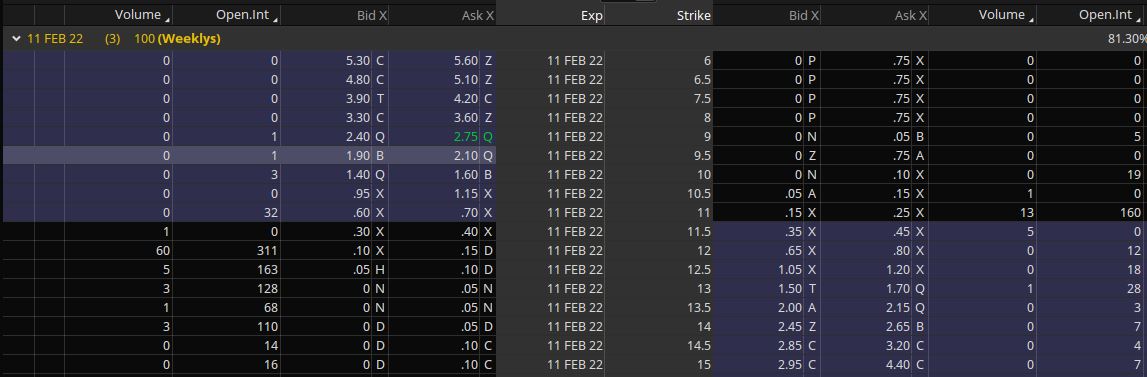
See how there’s almost no volume or OI? This causes the bid-ask spread to be MASSIVE — 10 cents between 35 and 45 cents.
If you buy these contracts, you’re fighting an uphill battle. You have to lock in huge gains to make up for the enormous spread.
This is why it’s critical to pay attention to volume and OI — so you know the contracts you’re trading have a lot of liquidity.
How to Weaponize Volume & Open Interest
Trading options without liquidity metrics is like driving with blinders on — I don’t advise it. You can lose out on key data.
If you follow my alerts, you know I mainly trade short-dated puts. So tracking volume is critical.
”“The
After over a decade of experience, Tim Grittani compiled all his valuable trading tips and released his “Trading Tickers 2” DVD…
Without being able to see the volume each day, it would be far more difficult to confidently execute day trades on options contracts.
Similarly, if I’m shopping for a longer-term swing trade, open interest is my supermarket.
I can’t tell you the number of times I’ve noticed tens of thousands of contracts sitting in open interest on a stock, only for some huge piece of news to drop a month later, sending the share price surging.
One recent example is Ford Motor Company (NYSE: F). By mid-2021, The F options chain had over $100 million in premium set to expire in January 2022.
Most of these bets were placed in 2020 when F was trading between $4 and $10. The $5, $10, $15, and $20 strikes all had six figures of open interest heading into their expiration dates last month.
What happened next isn’t surprising. The ‘smart money’ was correct once again…
In December 2021, F announced plans to enter the electric vehicle industry … and the chart started to go parabolic. Take a look:

F 2-year daily chart — courtesy of StocksToTrade.com
From bottom to top, F went from $4 to $25 — gaining 550% in under two years!
By the time expiration came along, every single one of those high-volume contracts was up hundreds — if not THOUSANDS — of percent!
Had you been tracking contracts with high open interest, you might’ve seen this long-term setup emerging before the majority of the market.
See how you can learn to use volume and open interest to your trading advantage?
Of course, this varies from trade to trade. Don’t expect every weekly contract with high volume (or long-term call with huge open interest) to pay dividends.
Remember: Many options contracts expire worthless!
For every Ford-level win among option buyers, there’s guaranteed to be another massive stack of premium getting completely decimated elsewhere on another chain.
Sometimes the option traders win, but many times the option sellers are the ones polishing their swords in victory.
It’s a constant war — get caught in the middle and you could get sliced up.
But if you understand volume and open interest, and use them as your helpful guides on the battlefield — you could potentially be the one delivering the fatal blow.
Key Takeaways
- Volume is a calculation of short-term liquidity, measuring the total number of contracts traded on a particular contract in a given trading day.
- Open interest is a calculation of long-term liquidity, measuring the total number of contracts held in open positions on a particular strike price.
- Understanding the difference between the two is vital in choosing your trade’s time frame and the contract’s expiration date.
- Volume and open interest can be valuable indicators of future price direction, but you should never enter a trade solely based on the information they provide.
Final Thoughts
There you have it: Everything a veteran options trader knows about volume and open interest.
I hope this lesson helps you better understand these crucial liquidity metrics.
Use them carefully and conservatively to guide you in your options trading.
