The question on every trader’s mind — when will the bear market bottom?
Well, this is impossible to predict with certainty.
But if you know what to look for, there are technical and historical indicators that give hints as to where the bottom might form.
I’m always reminding students that they must know their history.
Today, I’m gonna show you a few examples of how studying the history of the market can help you be prepared for the future.
Take it from me. I accurately predicted the 2022 market crash, way back in December of last year. And I did it by studying history.
But I always look at the technicals first, specifically the ‘big picture’ daily and weekly charts, to see if any obvious indicators are screaming at me.
Sure enough, as I was looking over the Invesco QQQ Trust (NASDAQ: QQQ) weekly chart last night, I noticed something HUGE that I hadn’t spotted before…
Technical Indicators
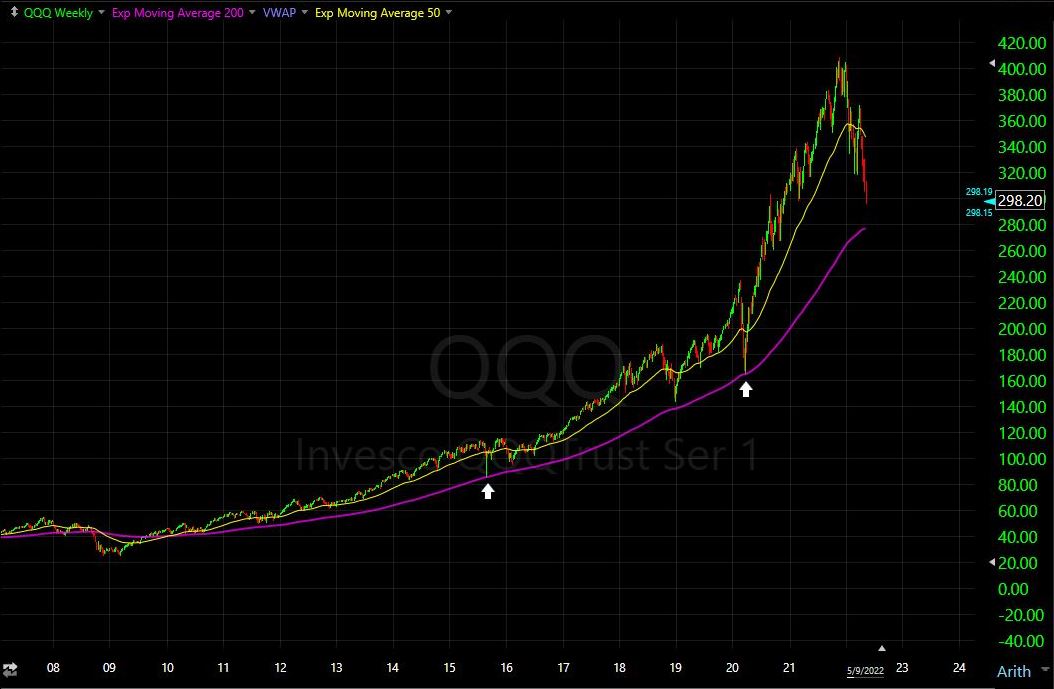
Looking at the QQQ weekly chart, there’s one specific technical indicator that could show us where the bottom will form — the 200 exponential moving average (EMA).
NOTE: I don’t usually track the 200 EMA, but it’s impossible to ignore on this chart.
QQQ hasn’t traded below its 200 EMA on the weekly chart since July 2009! Talk about long-term support…
Take a look at the chart below, where the 200 EMA is represented by the purple line:
QQQ weekly chart from 2008 to present
For more than a decade, the 200 EMA has acted like a trampoline for QQQ — it always bounces off of it.
Just look at the white arrows under the 2020 pandemic sell-off and the August 2015 ‘flash crash’…
Both times, QQQ found a bottom at the 200 EMA — practically to the cent.
So, why should you care?
Because all you have to do is check to see where QQQ’s 200 DMA is currently sitting — $277 at the time of this writing — to form an initial price target on the way down
So, first and foremost, I’m gonna trust the technicals and watch for bottoming signals near the mid-$270s.
My advice? Be prepared for a potential bounce in the overall markets around this level.
But what happens if QQQ slices through $277 like butter? What’s the next level you should watch for?
If the technicals don’t bear fruit, I’ll generally look to the history of the stock market for answers…
Historical Indicators
One of the most important lessons I learned in Tim Sykes’ Trading Challenge is that you’ve gotta know your history if you wanna be a winning trader.
And historically, there have been few better measures of index overvaluation than that of the legend himself, Warren Buffett.
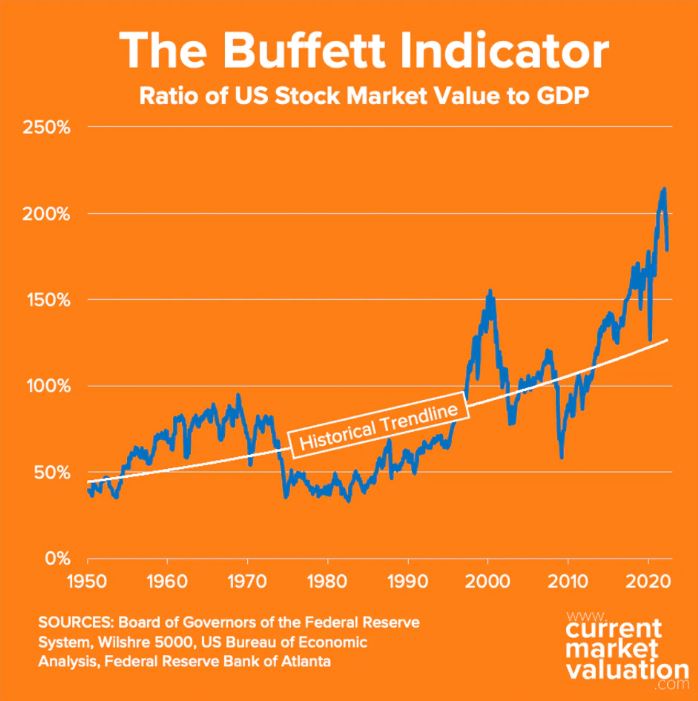
“The Buffett Indicator” as it’s known today, measures the ratio of total stock market value to GDP.
Since 1990, it’s been a stunningly accurate prediction tool when evaluating the possibility of an imminent market pullback.
Now, it could also help us determine when a bottom might be in…
Take a look at this chart that lays the Buffet Indicator over its historical trendline:
Are you seeing what I’m seeing?
Bottom line: The Buffett Indicator has never been as inflated as it is today (except for four months ago, at the top of the market).
Think about this…
In 2000, at the blow-off top of the dot-com bubble, the indicator had a reading of 67%…
Today, even after going through four months of a brutal bear market, it reads a whopping 179% — projecting that U.S. stocks are still 34% overvalued.
If QQQ drops another 34% from the time of this writing, it’ll be trading for just under $200.
The $200 level also coincides with a potential 50% correction in the index from peak to trough.
And if that happened, it would be around the same % drawdown as the 2008 crash. Interesting…
My advice? If you’re reading this in the future, and QQQ has already lost the mid-$270s — look out below, near $200, for a potential bottom.
Final Thoughts
Quite frankly, I’m not sure when this bear market will end.
I’ll let you in on a little secret … nobody does.
But as a trader, you’ve gotta take all of the information that you can get and try to develop a game plan.
Following the history of the stock market — and consistently reliable technical indicators — can help you do just that.
[VIDEO] A Rare Live Interview With Two Millionaire Traders...
To trade options, you DON’T NEED:
❌ A big account…
❌ To stare at your computer all day every day…
❌ A stockbroker…
Because there’s a way to trade stocks (from home) without struggling through the unnecessary risk and hassle most newbies go through…
To get started…
Click here to watch a rare interview between these two millionaire stock traders


