Happy Friday, Evolvers!
And what a week in the stock market!
The major indexes finally started ripping to the upside out of a sustained sideways channel, providing the market with a much-needed relief rally.
To give you some context … In the past five days, the Invesco QQQ Trust (NASDAQ: QQQ) is up 3.78% while the S&P 500 ETF Trust (NYSEARCA: SPY) is up 2.63%.
These may not sound like massive moves, but I believe they’re significant against the backdrop of this historic bear market. It’s all about context…
After so many weeks of doom and gloom, I can feel the difference in sentiment this week. Furthermore, I’m starting to see a variety of beaten-down charts starting to form into bullish setups.
The Next 46 Days Can Put Your Account on the Fast Track

With many stocks crashing left and right, many people are having a difficult time growing their trading accounts right now.
But this coming Thursday July 28th at 8 p.m. ET…
Tim Sykes will reveal a strategy that’s so powerful he believes traders have the potential to grow a $1,000 account into a $10,000 account in just the next 46 days!
But enough small talk. It’s Friday, so it’s time for some Q&A. I’ve received a lot of questions from you all this week. But one question, in particular, stood out from the rest.
Keep reading to hear my full breakdown…
Is the bear market finally ending? I’m hearing a lot of talk about the possibility of a ‘sustained rally.’ Do you think we’re poised for a serious move to the upside in the overall markets?
I’ve received this question, or some version of it, more than any other this week.
So I’m gonna devote this entire Q&A to breaking down what I think about this topic.
Let’s address this burning question…
I’ll be honest. I don’t know (and no one knows) if the bottom is in … but it’s certainly looking like a bottom was made on June 17.
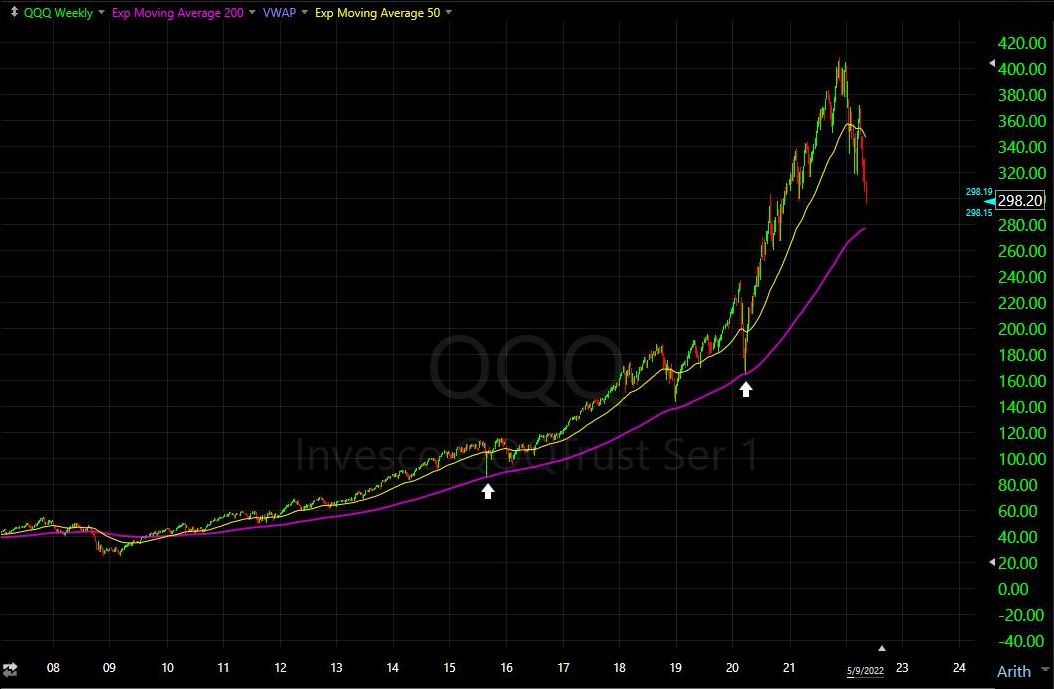
And if you recall, I posted the QQQ chart and pointed out how it was signaling this potential move back in May. It looked like this…
QQQ weekly chart from January 2008 to May 2022
When I posted this chart, I identified one specific technical indicator that I believed could be signaling where a bottom could form — the 200 exponential moving average (EMA).
I don’t usually track the 200 EMA, but it was impossible to ignore on this chart (represented by the purple line).
Bottom line: The QQQ hasn’t traded below its 200 EMA on the weekly chart since July 2009! Talk about long-term support…
Now let’s zoom in a bit and see what’s happened since the QQQ tested its 200 EMA…
QQQ weekly chart from 2017 to present
Well now, would you look at that?!
Just as I predicted, we got a strong bounce in the overall markets the day after the QQQ tested its 200 EMA.
This isn’t a coincidence. Rather, it’s the power of accurate technical analysis and grasping historical context.
One of the most important lessons I’ve learned from Tim Sykes is that you’ve gotta know your history if you wanna be a winning trader.
And right now, Sykes is embarking on a brand-new challenge — The 46-Day Account Accelerator. Click here to see how you could potentially add an extra zero to your trading account in just 46 days!
Now, back to the question at hand. Is the bottom in?
I can’t say for certain whether June 17 was the ultimate low or not. No one can.
But I will say that there are some technical and fundamental bottoming signals occurring that are hard to ignore.
From here, I think big tech earnings will play a huge role in determining the near-term direction of the major indexes.
That said, I need to stress that there’s no way to predict market direction with total certainty. You must use all the tools at your disposal — like the ones I’ve laid out above — to try and find conviction in your trading.
For now, we’re all in the same boat. We’ll have to wait and see if this bottom holds or not…
Final Thoughts
Quite frankly, I’m not sure when this bear market will end. Nobody is.
To me, things are looking more bullish than they have in quite some time, but I can’t be sure about this.
As a trader, you’ve gotta take all of the information that you can get and try to develop a game plan.
Following the history of the stock market — and using consistently reliable technical indicators — can help you do just that.
Growing A Small Trading Account? Check this Out

When multi-millionaire trader Mark Croock first started trading, he was an overworked and underpaid accountant…
So he knows what it’s like to start small while wanting to massively grow your wealth as quickly as possible.
That’s why he just recorded a step-by-step training that reveals what he believes is the best options trading method for someone trading with a small account.


