In the world of trading, knowing your history is essential to making informed decisions about current trends.
And now more than ever, understanding what’s happened in the past can potentially help you trade the current market conditions more confidently.
Let me explain…
The market is currently experiencing a unique situation where the Fed is hiking interest rates, but stocks are still performing well…
However, a closer look at historical chart patterns reveals that the market has never bottomed before the Fed stopped tightening in previous bear markets.
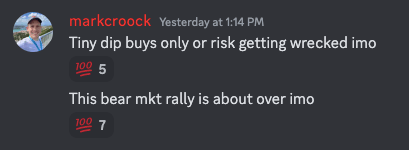
This fact, along with some particularly bearish technical indicators, leads me to believe that the market could face a big dip soon.

You may be wondering why you should listen to me on this subject…
Well, in April 2022, I made a similar prediction about the market heading lower … and I was exactly right.
Over the following five months, the SPDR S&P 500 ETF Trust (NYSEARCA: SPY) tanked more than 20%, dropping from $450 to a low of $357.
And now, I’m starting to get the same inklings I did in 2022…
With that in mind, let’s examine the technical indicators that are giving me concern and explore why you must pay attention to key price levels and historical patterns to navigate this crucial crossroads for the markets.
Keep reading and I’ll show you what I mean…
The Market is Still Fighting the Fed
Stocks usually struggle during periods of quantitative tightening (QT) — where the Fed is raising interest rates and decreasing its balance sheet.
This is what happened last year. As the Fed attempted to combat decades-high inflation, the SPY went down over 18% in 2022.
But so far, 2023 has seen traders sing a different tune. The SPY is up 8% YTD, even as the Fed continues hiking interest rates…
However, here’s the interesting part…
In previous bear markets, the stock market has never bottomed before the Fed stopped tightening. Not once.
Again, this is why you must know your history to be a competent trader…
From 2017 to 2019, the Fed tightened aggressively, leading to an extended period of flat returns for the major indexes.
But once the Fed changed course and began easing again in early 2019, the market started ripping … like clockwork.
This fact alone makes me think the market has further to drop this year, which is why I’m leaning bearish in the current environment.
Bearish Technical Indicators
More than any of these fundamental issues, I’m turning to technical analysis to guide my trading.
And the technical indicators on the major indexes are looking bearish to me…

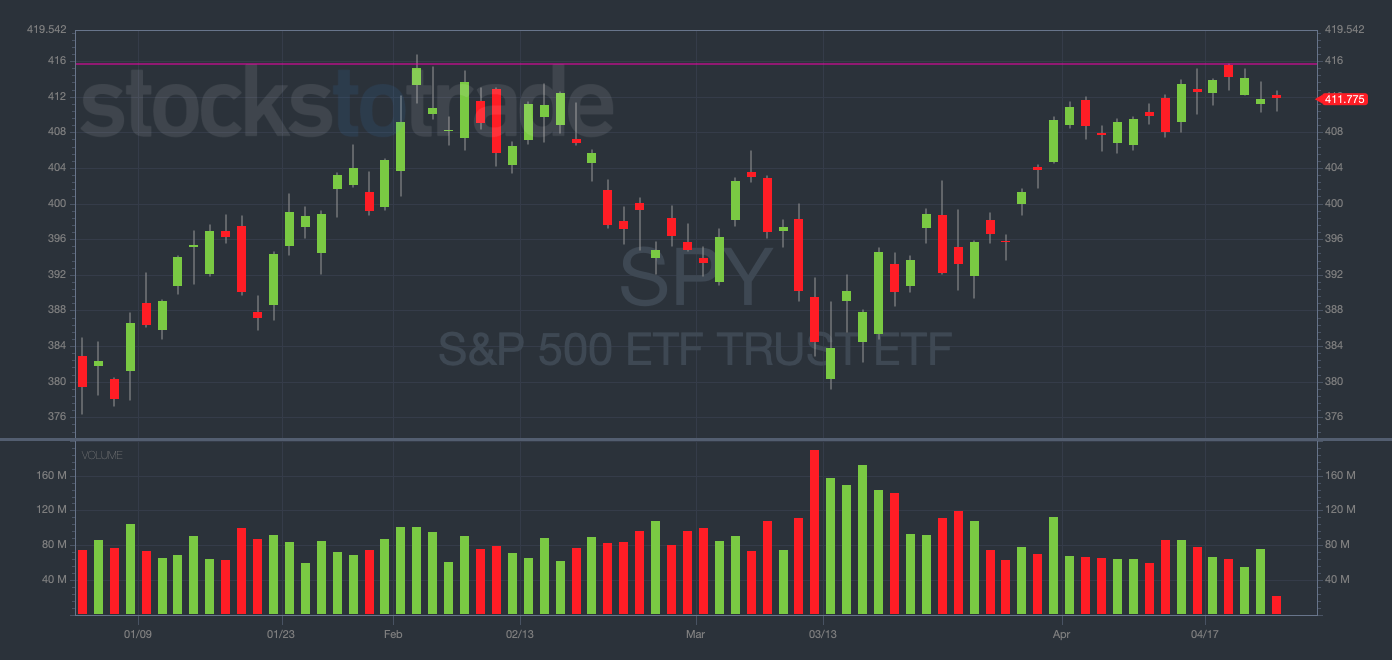
SPY YTD daily chart — courtesy of StocksToTrade.com
Take note of where the SPY chart topped out in early February … around $415 (indicated by the purple line).
And after that, the index tanked for six weeks straight, trading all the way down to $379.
Now, notice where the chart is sitting currently … right around $415 again.
Many times before, I’ve stressed the importance of watching key price levels, like this one. And this time is no different.
WARNING: Stocks tend to get rejected at predictable levels time and time again.
Be very cautious with any long positions as SPY teeters around $415. Personally, I wouldn’t want to be long anything at these levels.
Additionally, there’s another technical indicator giving me pause on this rally … the Volatility Index (VIX).
The VIX is currently trading around $16.75 — its lowest level since September 2021.
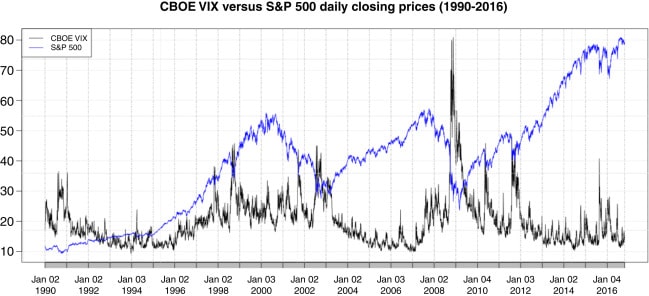
And while low volatility may sound bullish … If you overlay the VIX and SPY charts, you’ll see it’s often foreshadowing exactly the opposite…

VIX vs. SPY chart — courtesy of ScienceDirect.com
As you can see, every time the VIX trades at or near its lows, the market tends to enter a prolonged downtrend — or face a quick dip — shortly thereafter.
Don’t ignore history. Be incredibly careful at this crucial crossroads for the markets.
Final Thoughts
This is not the time to make risky trades, Evolvers!
Avoid speculative long positions and be prepared for some major volatility in the near future.
I think this bear market rally is just about over. Trade accordingly.

