When the stock market reverses out of a multi-month downtrend, incredible trading opportunities can emerge on the way up…
Sound familiar? It should … because this is exactly what’s happening with the current market conditions.
WARNING: If you aren’t updating your watchlist as market sentiment shifts, you risk falling behind other traders who are doing just that…
After spending nearly four months in a brutal downtrend, the major indexes bounced back with a vengeance this week…
This morning, the SPDR S&P 500 ETF Trust (NYSE: SPY) reclaimed its 200-day moving average while simultaneously topping the $450 level for the first time since February 22.
Big picture: SPY is up more than 350 points from its lows just six days ago.
With such a major shift in trader sentiment occurring, I think it’s time to do a mid-week watchlist update.
I’ve added several names to my list of potential five-star setups. Let’s get right into them…
Nvidia Corporation (NASDAQ: NVDA)
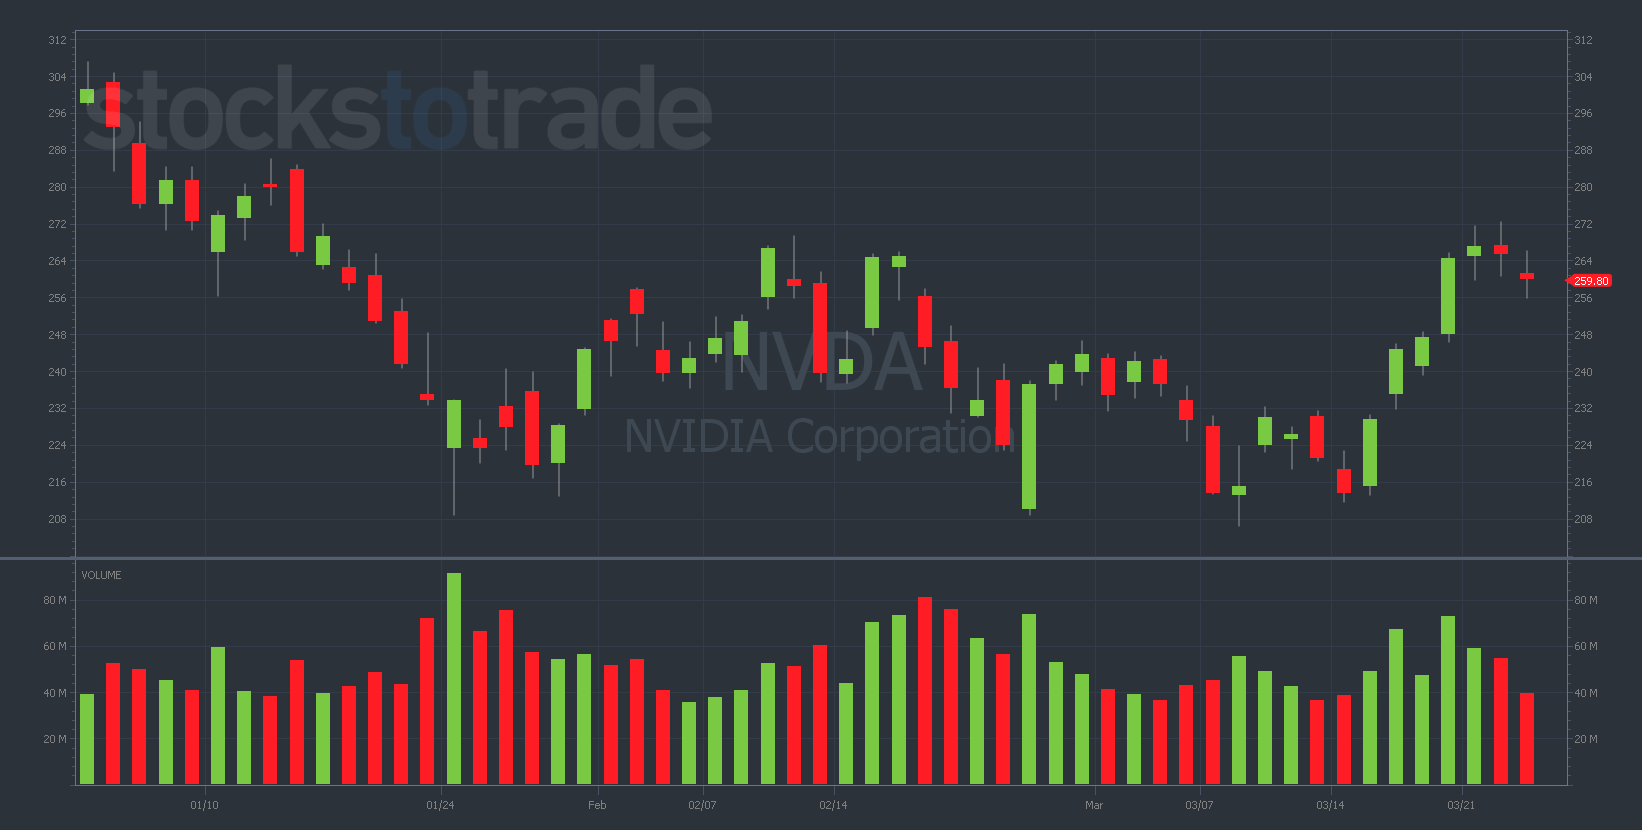
Key Levels: $255 (support) and $270 (resistance).
Anyone who’s been following my alerts for a while will know that NVDA is one of my favorite stocks to trade.
I’ve traded this ticker over and over because it has the volatility, volume, and retail enthusiasm I look for in my short setups.
Yesterday afternoon, I pointed out the strong resistance near the $270 level, as it closed at $265.
After stringing five green days in a row together, the NVDA chart was looking overextended.
Sure enough … NVDA’s price action today began with a morning panic to $257.
The chart eventually dipped to $255 before bouncing back to $260. (This is the kind of mouthwatering volatility I patiently wait for!)
That said, I don’t think anyone should be going long NVDA puts at this moment.
Take the meat of the move when your price targets hit — and avoid greed and FOMO at all costs.
But that doesn’t mean you shouldn’t keep NVDA high on your watchlist. Don’t sleep on this chart — it can change in a heartbeat.
NVDA continually presents beautiful trading setups (if you know what to look for). Watch this one any time it nears $270.
Tesla Inc. (NASDAQ: TSLA)
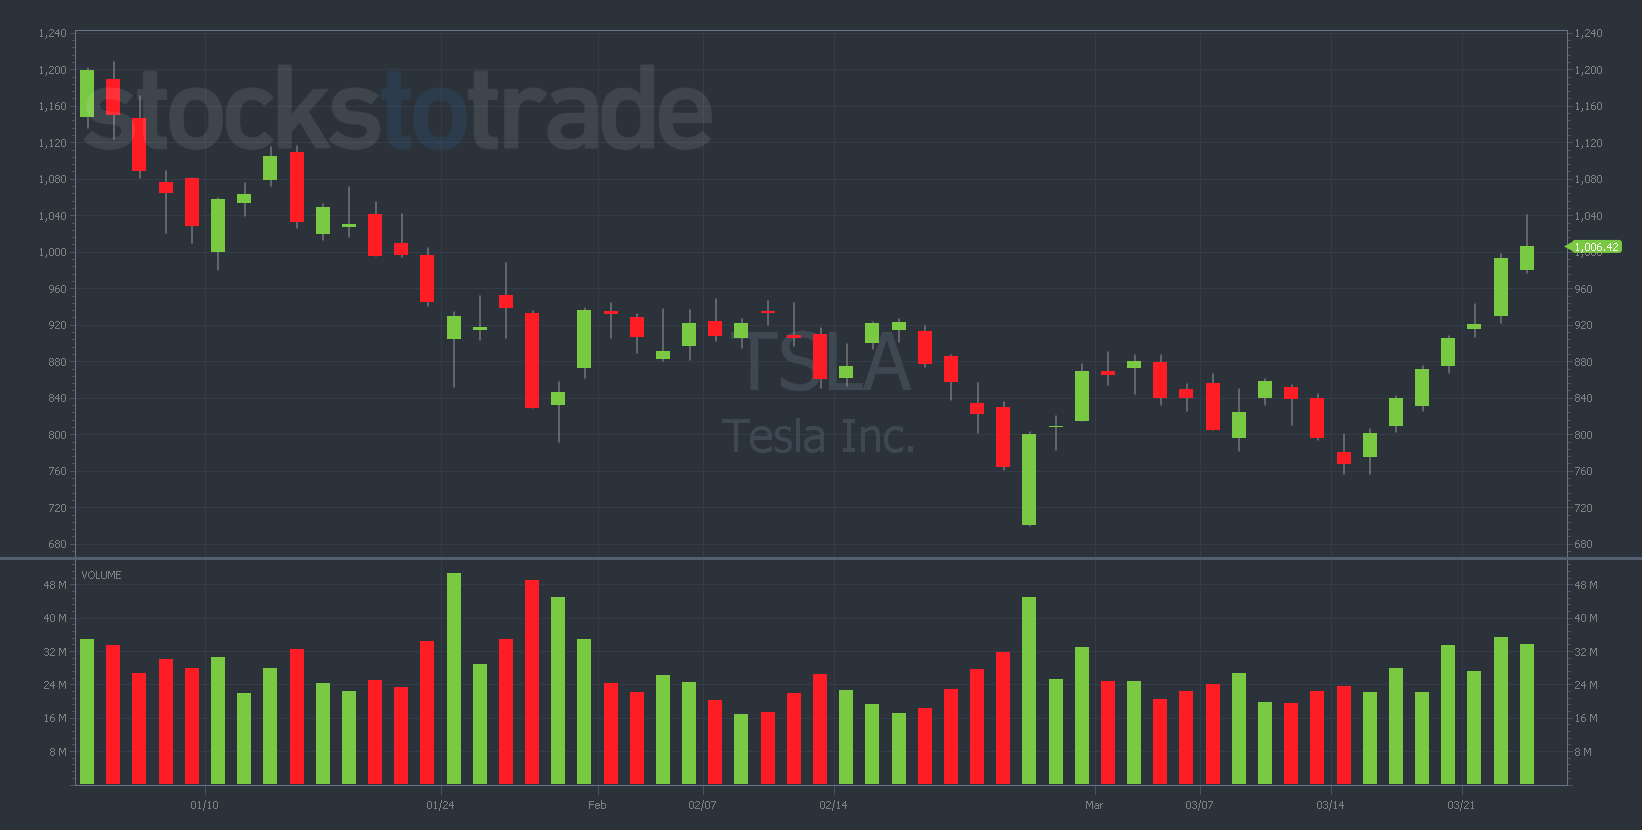
Key Levels: $950 (support) and $1,000 (resistance).
TSLA is a similar setup to NVDA — the chart is up seven days in a row and overdue for a pullback.
And just like NVDA’s reliable resistance at $270, TSLA has a HUGE psychological barrier at the $1,000 mark.
It briefly surged beyond $1,000 this morning, but it has been rejected back to $994 at the time of writing. This is a bearish indicator.
If the chart had backtested the $1,000 level — but held it — I probably wouldn’t even think about TSLA for a puts play.
But the fact that TSLA has sold off below $1,000 is notable. I see a lot of similarities to the NVDA chart, which took a solid dip already.
In that spirit, I bought TSLA 4/1/2022 $950 puts for $21 around 2 p.m. Eastern today.
I haven’t had much success shorting TSLA in the past, but I can’t ignore the technical indicators I’m seeing in the chart today.
I’m thinking now is my time to finally nail the TSLA puts trade.
GameStop Corp. (NYSE: GME)
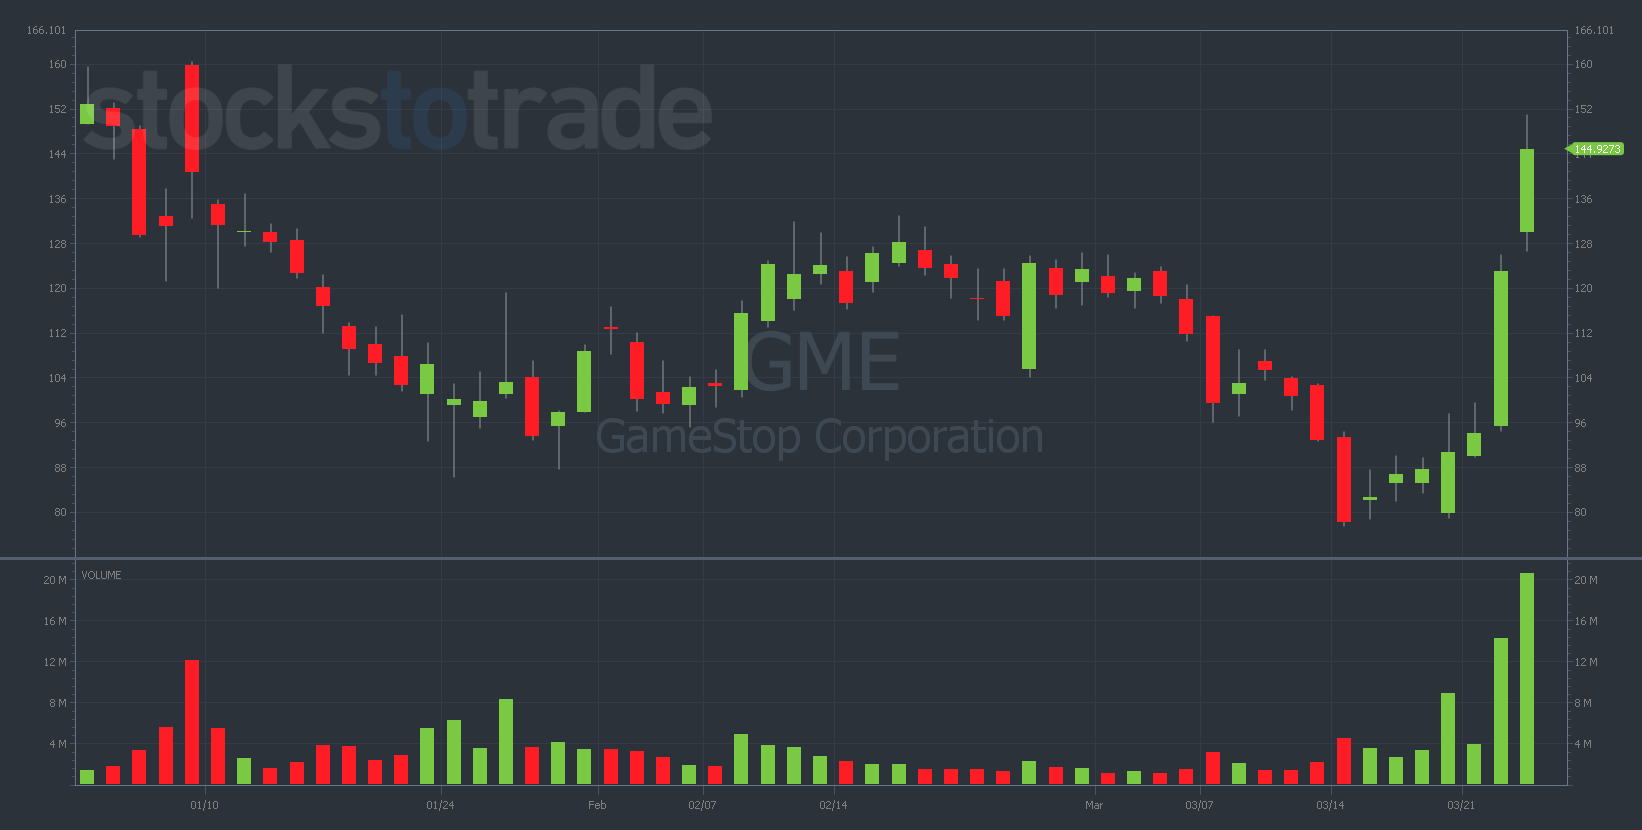
Key Levels: $80 (support) and $150 (resistance).
Seemingly out of nowhere, meme stocks have come roaring back in unbelievable style this week.
After GME Chair Ryan Cohen announced he was buying an additional 100,000 GME shares, the stock went on an eye-popping momentum surge from $80 to low-$150s.
Additionally, GME announced it’s launching an ethereum (ETH)-based ‘NFT Marketplace’ with Loopring (LRC) integration. Crypto + GME = a retail trader’s fantasy!
And speaking of NFTs, my mentor Tim Sykes recently told me he’s more excited about them than anything else in the markets right now…
That’s why Sykes is hosting a SPECIAL EVENT on Wednesday, March 30 where he’ll break down how a 25-year-old student made $1 million in 10 hours … trading NFTs! Click here to sign up.
Now, back to GME…
If I’ve taught you anything, you should know that Newton’s law of gravity applies to stocks just as much as it applies to apples. What goes up must come down!
WARNING: Because of high implied volatility (IV), GME options are extremely expensive. This is something I see a lot of newbies overlooking, but you MUST take it into account on any potential GME trade!
As usual, I’m looking for a big round-number rejection on the GME chart — and we got that today near the $150 level.
On the other hand, the chart has some decent support at $135.
At the time of writing, GME has bounced off of $135 and looks to be curling back up.
I’m hoping for another boost to $150 (or even $160). At that point, GME could be setting up for an incredibly juicy puts play — but we’ll have to patiently wait to see what happens.
Final Thoughts
Wow … what a week so far!
It’s always exciting to trade a big shift in market sentiment — and the past few days have been no different.
REMEMBER: Bullish market reversals often lead to incredible short setups.
Keep your eyes on these charts over the next week or so as the price action develops.


