You can learn all of the trading lessons in the world, but they won’t mean anything if you can’t put them into action…
At some point, you have to take all of the market knowledge you’ve gathered and start actually putting it to work in the markets…
So, today I’ll walk you through my thought process behind trading calls on a particular big-tech giant last Thursday.
I was very happy with several aspects of this play, particularly my entry and exits…
Later, I’ll show you how scaling out of a position can help you technically, psychologically, and financially.
Additionally, this trade was triggered by one of my favorite chart patterns of all time…
I’d like to explain why this pattern tends to work and how you can identify similar setups in the future.
Keep reading to see how one of my bread-and-butter chart patterns led me to a seriously juicy trade…
Identifying MSFT’s First Green Day
Last Thursday, there was one chart I couldn’t ignore — Microsoft Corp. (NASDAQ: MSFT).
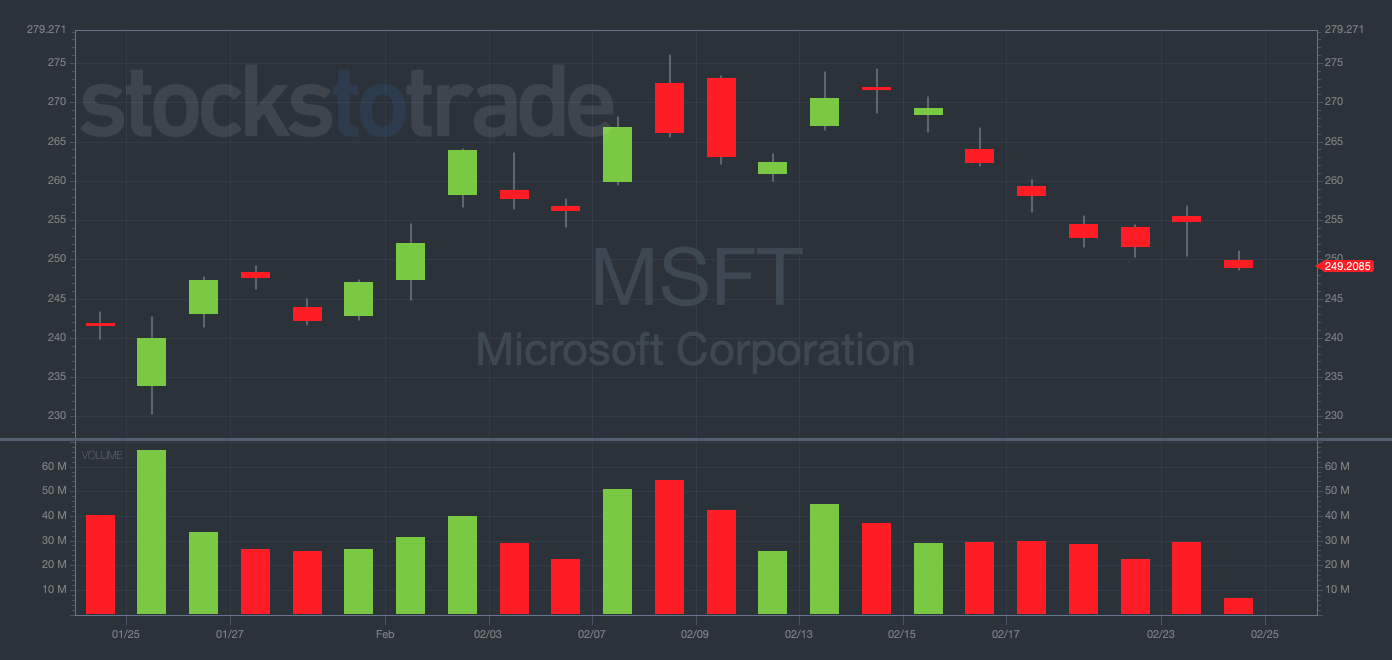
MSFT 1-month daily chart — courtesy of StocksToTrade.com
The trading day started out well for MSFT. After six consecutive red days, the stock was green at the open, implying the start of a first green day pattern.
The first green day is one of my absolute favorite patterns to trade (and it works just like it sounds).
The pattern occurs when a stock finally puts in its first green day after a long string of lower opens.
Those who have followed my trading for years know that I have a negative bias. I often prefer to buy puts than calls, but it all depends on the chart…
And if I’m gonna go long and buy calls … I often do so on the first green day.
Why does this pattern tend to work so well?
The first green day pattern is related to momentum and relative strength. Stocks can only go up or down in a straight line for so long.
WARNING: No trend lasts forever!
Once a stock is already in a steady downtrend, I’m not looking to short it. Rather, I’m waiting to make the contrarian move and go long once it shows initial signs of strength…
And that, my friends, is where the first green day comes into play.
After seeing the green daily candle forming, I knew I wanted to go long on MSFT.
From there, it was about picking the correct entries and exits…
How I Chose My Entry and Exit Points
Beyond identifying the first green day, I had to decide where I wanted to enter this MSFT trade…
I’ve mentioned before that I try to avoid going long in the mornings.
Here’s why…
Over my many years of professional trading, I’ve noticed that the first 30 minutes of market hours can bring huge opening flushes.
And once these flushes begin, they can lead to further capitulation.
(SHOCKING) From 9-5 Cubicle to Millionaire Trader
 This millionaire trader used to work in a place just like this and woke each morning hating the boring cesspool he called “work”…
Fast forward 10 years later…
He’s gone from underpaid accountant to sitting on nearly $4 million in trading profits.
And it’s all thanks to 1 bizarre “switch” he made to his trading strategy that helps him nail 100%… 200%… and even 400% trades in less than 24 hours.
In fact, he recently did a live training session unveiling this crucial “switch” and how he’s been able to reap nearly $1 million per year since implementing it.
That’s why for a limited time he’s agreed to make this training session open to the public…
This is why I lean toward making put trades early on in the trading day. And if I’m looking to go long, I try to wait until the second half of the day.
Again, here’s why…
After the morning craziness settles, and the first half of the trading day has passed, there’s usually a different energy in the markets.
As traders can smell the closing bell drawing near, they often rush to get their orders in, positioning themselves for the following day.
This gives first green day patterns extra juice into the close, which is exactly what I was predicting as I entered MSFT mid-day on Thursday…
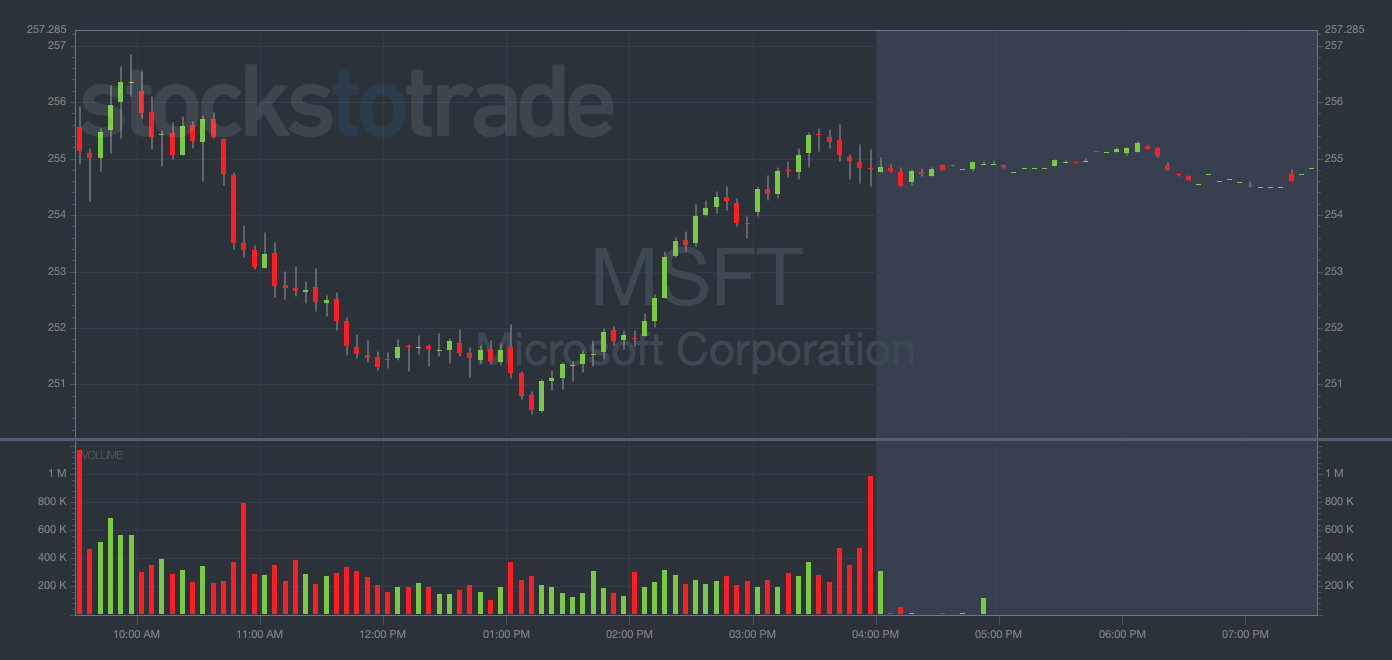
MSFT 1-day 5-minute chart from Thursday, February 23 — courtesy of StocksToTrade.com
From 10:30 a.m. to noon, the stock dropped from $256 to $252. (Again, this is why I try to avoid going long first thing in the morning!)
But because I saw the first green day at the open, I had a strong feeling that MSFT would recover during the second half of the day.
With this conviction, I felt the early-morning dump was a dip-buying opportunity…
So, I promptly opened my initial position, buying 100 MSFT 2/24/2023 $255 CALLS for $1.08 at around 11:20 a.m. (total starting stakes: $10,821).
NOTE: I bought calls expiring the following day because I viewed this as a short-term play and didn’t want to have any exposure over the weekend.
My entry wasn’t perfect, as MSFT dropped another $2 down to $250 before pivoting upward, but that didn’t ruin my trade.
Before long, MSFT was reversing violently to the upside, and my calls were going deep into the green.
I knew it was time to start scaling out of the position, so I sold 50 (half) of my contracts at $1.39, another 20 contracts at $1.49, and the remaining 30 contracts at $1.84…
All in all, I was completely out of the play by 12:31 p.m., profiting $4,347.44 (+40.18%) in just over one hour!
Final Thoughts
I hope this trade breakdown helped you see the power of first green days and the importance of carefully choosing your entry and exit prices.
This wasn’t a massive trade for me, but I’m still very proud of booking such a solid win with one of my favorite chart patterns.
Keep your eye out for first green day setups like this one and you may find yourself making a similarly juicy trade on your own.


