Heading into the end of the week, I have my sights zeroed in on one sector — crypto.
To me, it’s not a matter of if crypto stocks will break down further, it’s a matter of when…
Even though the market has already gotten slammed this year, I think names like the ProShares Bitcoin Strategy ETF (NYSEARCA: BITO), Coinbase Global Inc. (NASDAQ: COIN), Marathon Digital Holdings Inc. (NASDAQ: MARA), and Riot Blockchain Inc. (NASDAQ: RIOT) are all ripe for more downside.
I like trading puts on crypto stocks for a simple reason — these speculative tickers rally based on hope, hype, and FOMO.
Then, they inevitably crater back to earth in predictable cycles (just like every other momentum stock).
But now, I think we’re in a new cycle where the environment for crypto is so hostile that the associated stocks can’t even mount a tiny rally.
To put this in perspective, BITO — a fund that tracks the price of Bitcoin (BTC) directly — is down 17% in the past month (and a whopping 51% in the past six months)!
Millionaire Trader and Crypto Expert Matt Monaco Went Live Last Night to Discuss the Coming Crypto Shock…
But I think the chart is one key price level crack away from a bigger drop that could lead to the absolute destruction of the crypto markets.
Let’s challenge my idea: Could these charts find a bottom and start to rip higher? Sure. Anything can happen in the stock market.
But if you look at the technical indicators in the charts, I think you’ll agree with me that the implied near-term direction for the crypto markets is down.
Keep reading and I’ll show you what I’m seeing…
BITO’s Bearish Indicators
For the most part, I’m a technical trader.
In other words, specific indicators in chart patterns give me the conviction to execute my trades.
NOTE: If you’d like to gain a deeper understanding of my entire trading strategy, you can check out my brand-new ebook right here.
Sure, there are other factors (like social media sentiment and fundamentals) that can influence my trading…
But for the most part, I look at charts and trust the patterns.
That’s exactly what I’ve done this week with BITO, and I can’t ignore what I’m seeing…
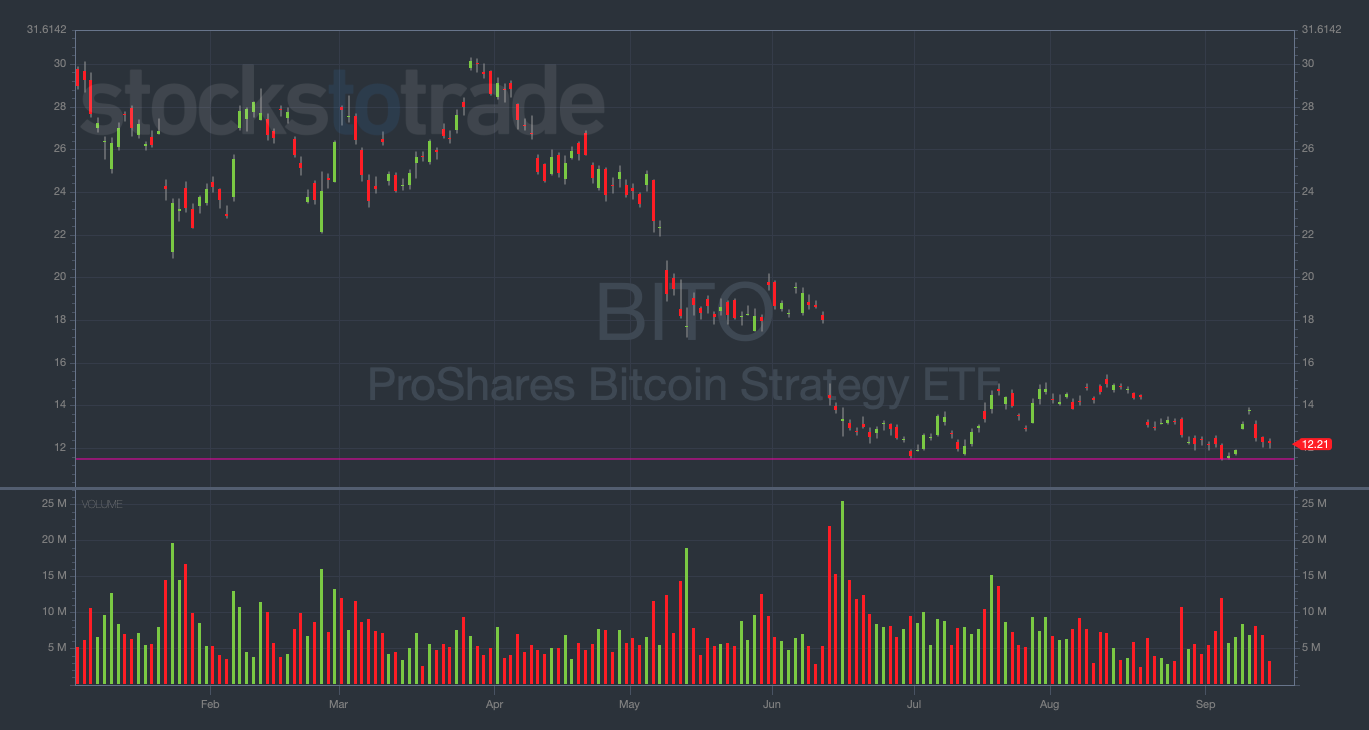
BITO YTD daily chart — courtesy of StocksToTrade.com
Notice the $11.50 level (where I drew the purple line), which has been rock-bottom support for the chart going back to late June…
Coming off of this level, every attempted rally has failed miserably…
Meanwhile, the chart has been continually rejected in the high $14s, forming a strong level of resistance.
Earlier this week, BITO was rejected before it even got to $14, which I see as an extremely bearish indicator.
If crypto was gonna reverse to the upside, you would think the BITO chart could at least crack $14, right?
I think it’s more likely that BITO re-tests — and probably loses — the $11.50 support level.
And if the chart falls below $11.50 … bulls should run and bears should start getting aggressive.
Furthermore, there’s another chart (closely related to BTC and BITO) that could be giving us an even stronger indicator of potential downside in the crypto markets.
GLD’s ‘Golden’ Short Signal
This morning, I sent you an email with the following SPDR Gold Trust (NYSEARCA: GLD) chart attached…
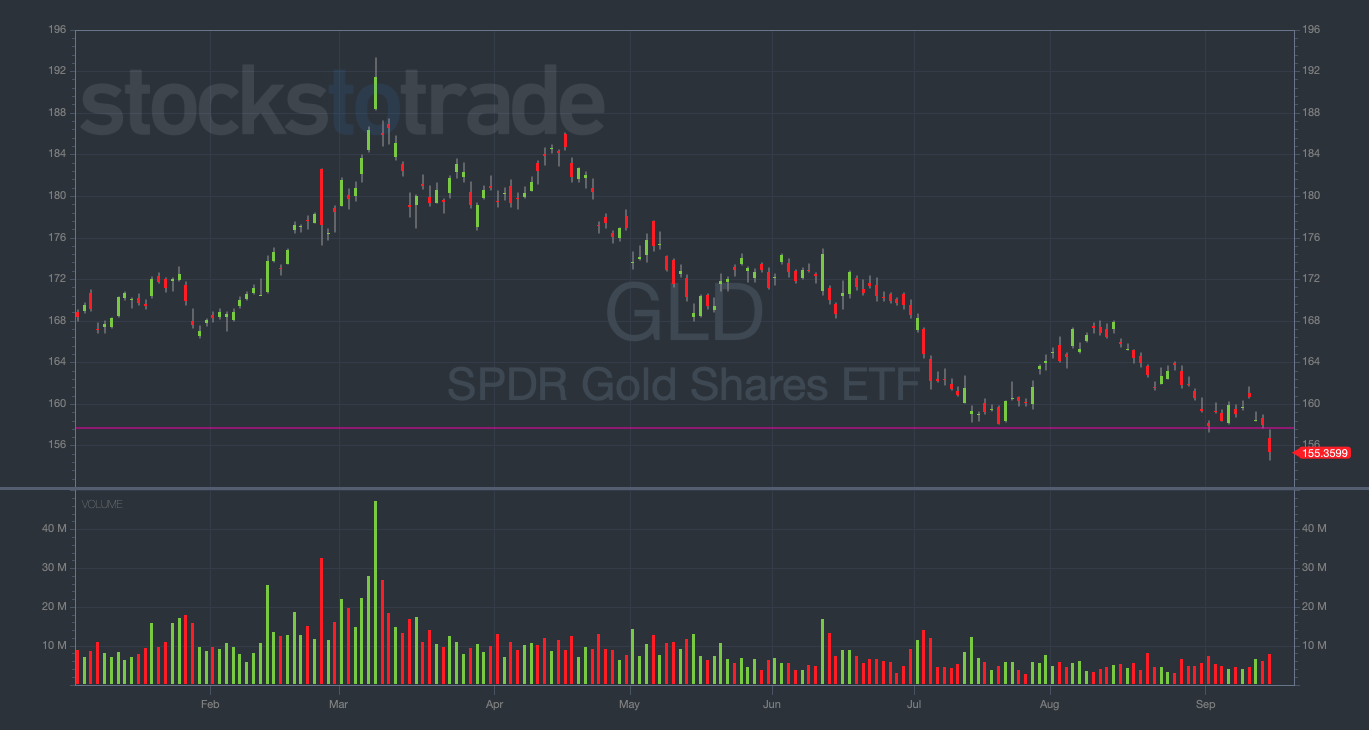
GLD YTD daily chart — courtesy of StocksToTrade.com
For anyone unfamiliar with the commodity markets, precious metals (like gold and silver) are closely related (and often compared) to cryptocurrencies.
After all, BTC has been hailed as “digital gold” by many crypto evangelists. You can’t get much more ‘on the nose’ than that.
So, it goes without saying that when GLD loses a multi-year support level … I’m on high alert for potential put-buying in the crypto sector.
And that’s exactly what’s happening currently…
GLD hasn’t closed below the low $157s since 2020 … until today. (It’s trading for $155.43 at the time of writing.)
I see GLD’s major support crack as a leading indicator for impending downside in crypto stocks.
In other words, I think it’s a signal to short crypto.
With that in mind, I bought GLD 9/23/2022 $152 Puts for $0.81 this morning.
Additionally, I’m holding BITO 9/30/2022 $11 Puts for the same reason.
Final Thoughts
Is there a guarantee that crypto will tank in the near term? Of course not.
But based on my technical analysis, I think the odds are pretty good…
It’s not too late to enter either of these trades.
But if you do plan on trading either of these setups, please do your own due diligence. You should never chase alerts without researching the play yourself.
Want to be alerted to hot trade ideas before anywhere else?
Breaking News Chat is the alert service that traders can’t get enough of. Two former financial analysts scour the stock market and news for stocks that could potentially spike and alert the room allowing you the chance to get in on the action.
Check out the alert for BEAT on September 15th:
This is a tool you’ll want in your trading toolbox.


