Inexperienced traders often see a rising share price and think one way — bullish.
But little do they know, a rising share price can actually be a negative indicator on a chart when it’s coupled with another key metric…
If a stock’s average daily trading volume is falling while the share price is surging, you should probably be leaning a different way — bearish.
WARNING: This is exactly what I see happening currently in the major indexes!
Both the SPDR S&P 500 ETF Trust (NYSEARCA: SPY) and the Invesco QQQ Trust (NASDAQ: QQQ) are marginally green on the week following six brutal red weeks…
That said, the buying volume hasn’t been anything to write home about.
The selling volume over the past few weeks was much greater than the buying volume has been so far this week.
And that leads me to believe that the bottom isn’t in yet…
The overall markets are seeing two simultaneous indicators that spell trouble: rising price and falling volume.
So … why should you care?
Because understanding what these technical indicators are saying could lead you to make better trading decisions in a wildly unpredictable market.
Are You Missing Out On Epic Trades?
StocksToTrade’s Breaking News Chat could be what’s missing in your trader toolbox…
You get two financial analysts feeding you stock news and alerts often before anywhere else while joining a community of traders like yourself.
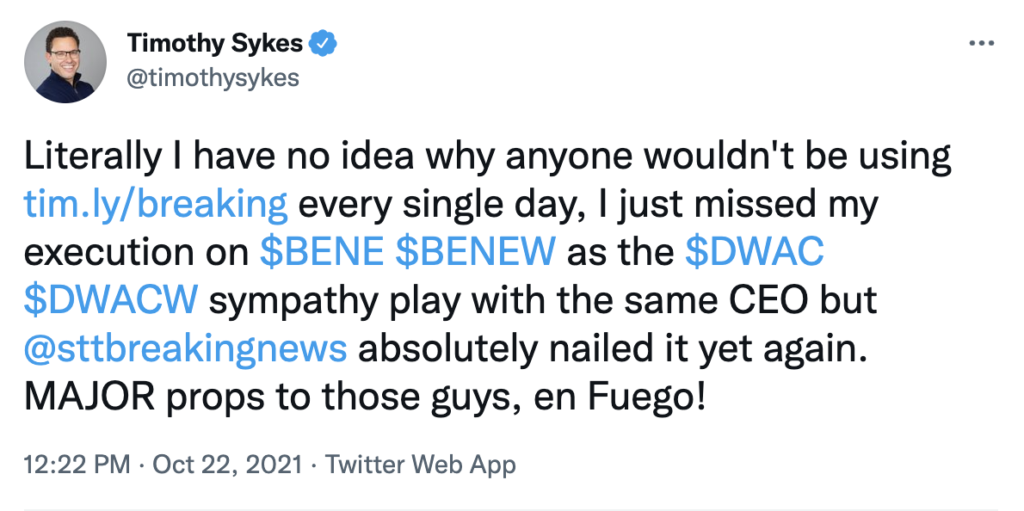
Tim Sykes encourages his students to use Breaking News Chat every day:

When a share price is steadily gaining while the daily trading volume is precipitously dropping — bulls should be cautious. And bears should consider getting aggressive.
Keep reading to learn how certain technical indicators — that may initially look bullish — can actually be huge red flags, pointing toward the markets heading lower…
Why These Indicators Are Bearish
Think about this logically, Evolvers…
If a stock is ramping to the upside, there are more buyers than sellers.
If the trading volume is soaring along with the share price, this means that each new day is bringing more buyers than the last.
But at some point, this balance flips…
You can look for this crack in a momentum rally by keeping a close eye on the daily and weekly trading volume of a stock.
If the share price continues to move higher, but you see the volume begin to fall off … that’s a sign that the rally is losing momentum.
Again, think logically.
If the volume averages no longer match the bullish price action, the appetite for buying is quickly disappearing.
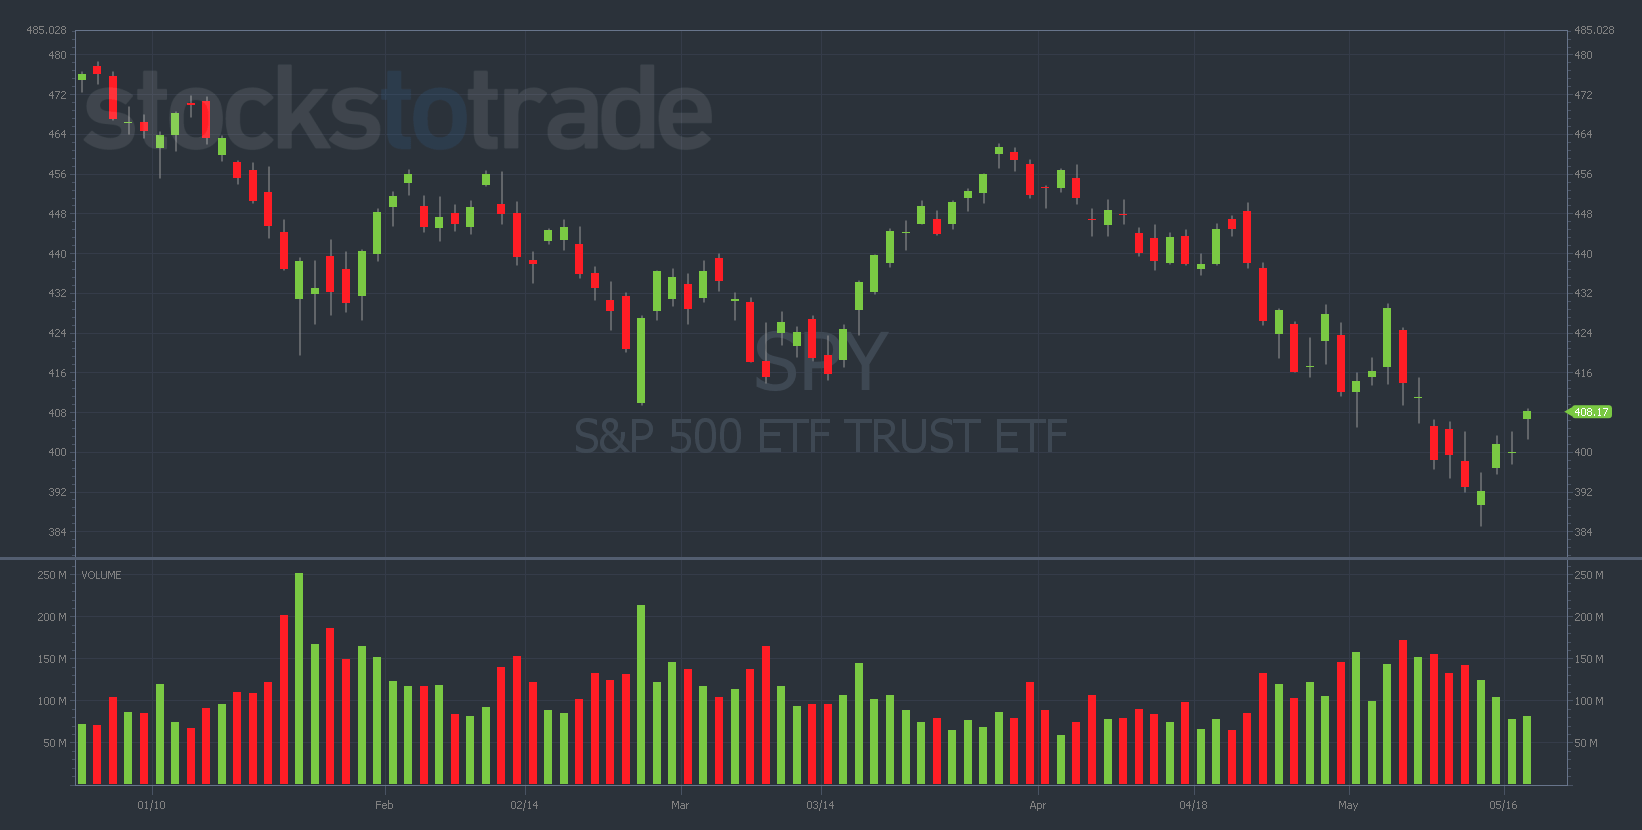
Look at the volume bars on the SPY daily chart. Notice how they’ve lost steam over the past few days while the share price has done the exact opposite…
SPY YTD daily chart — courtesy of StocksToTrade.com
With rising prices and falling volume, a dip in the chart is usually right around the corner.
To me, it’s not a question of if — only when.
Is my timing always perfect? No. Can I guarantee that the market is heading lower soon? Absolutely not.
But I can tell you that my experience leads me to believe that this ‘bear market rally’ is just that … a flash in the pan that will fizzle out soon.
Let’s take a look at some specific examples of how I’m seeing rising prices and falling volume in the overall markets…
Examples from the Overall Markets
In the pandemic-era bull market of the past few years, we saw rising prices every day.
A stock would soar to new all-time highs day after day on some ‘bullish headline’, building a momentum rally that many foolish retail traders thought would never end.
This is why you’ve gotta have a great trading mentor. My mentor Tim Sykes and I both predicted this market crash way back in December.
If you wanna take your trading to the next level, start where I did — in Tim Sykes’ Trading Challenge.
After all, Sykes is the one who taught me how to spot technical indicators. He gave me the superpower to notice things like this…
You don’t have to be trading a crazy momentum stock for today’s concept to apply. The dangers of rising price and falling volume are relevant to the major indexes as well…
And sure enough, this exact brand of price action has been notably present in SPY and QQQ this week.
Last Thursday, May 12, the major indexes hit a near-term bottom. Keyword: near-term.
On Friday, May 13, the market bounced hard. Large swaths of beaten-down stocks were up double-digits.
If you didn’t know what to look for, you might’ve gotten caught up in this ‘bear market rally’. But not me.
The trading volume on the indexes was extremely disappointing. While SPY surged more than 4% overnight, it only traded 104 million shares on Friday.
To put this in perspective, on May 5, when SPY was down nearly 4%, it traded 172 million shares.
If the red volume is that much bigger than the green volume, that’s indicating that the bears are still in control.
Going back further, on February 24 — when SPY made another near-term bottom before starting a massive relief rally over the last two weeks in March — it traded 213 million shares.
That green day had more than double the volume of last Friday. I can’t ignore that.
I’m looking for a 200 million+ volume green day on the SPY to be confident that the market’s put in a long-term bottom.
Final Thoughts
I don’t wanna rain on the bulls’ parade, but I can’t ignore the bearish signals appearing via rising price and falling volume.
Additionally, the news continues to be terrible for stocks. I don’t see why the market should be trading much higher in this news environment.
Pay close attention to the trading volume on the major indexes. If you know what to look for, it can help complete the story about what might happen next.


