As I watch the unbelievable price action in the energy sector, I’m seeing two of the leading oil charts — United States Oil Fund (NYSE: USO) and Chevron Corp. (NYSE: CVX) — look like they’re getting close to blow-off tops.
Take a look at the daily charts for both stocks below. Notice that both the share price and the daily trading volume are at year-to-date (YTD) highs.
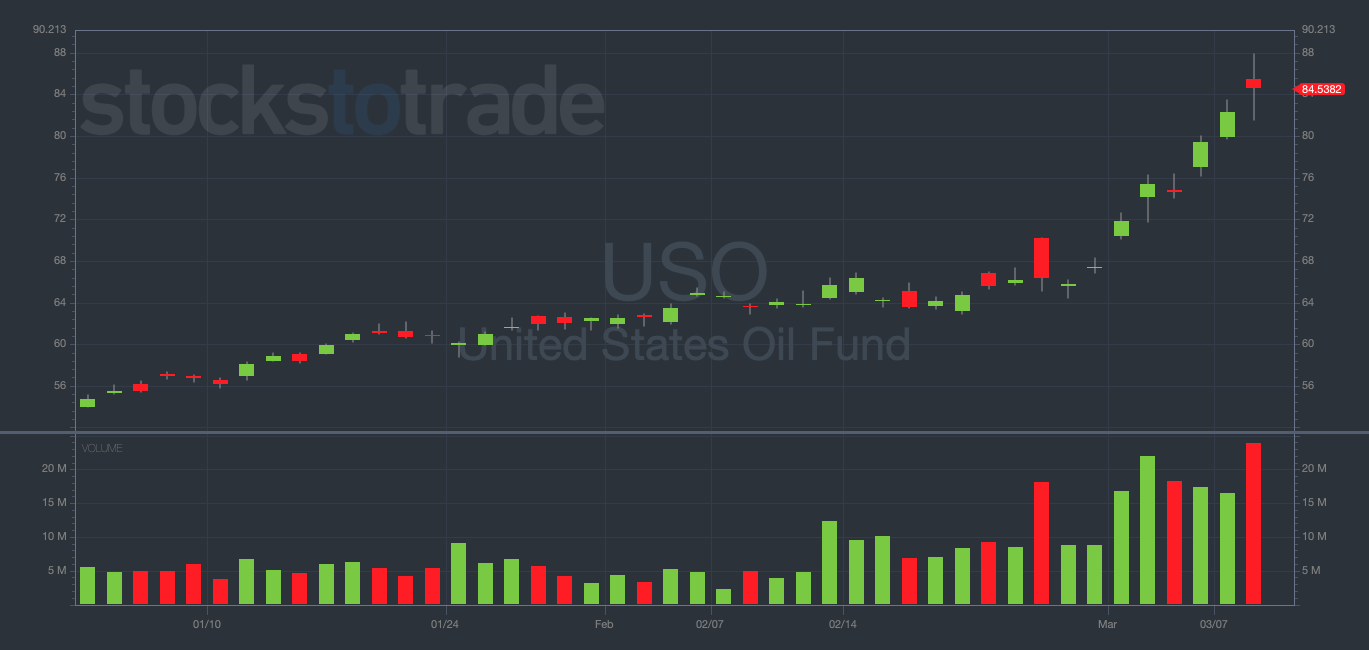
USO YTD daily chart — courtesy of StocksToTrade.com
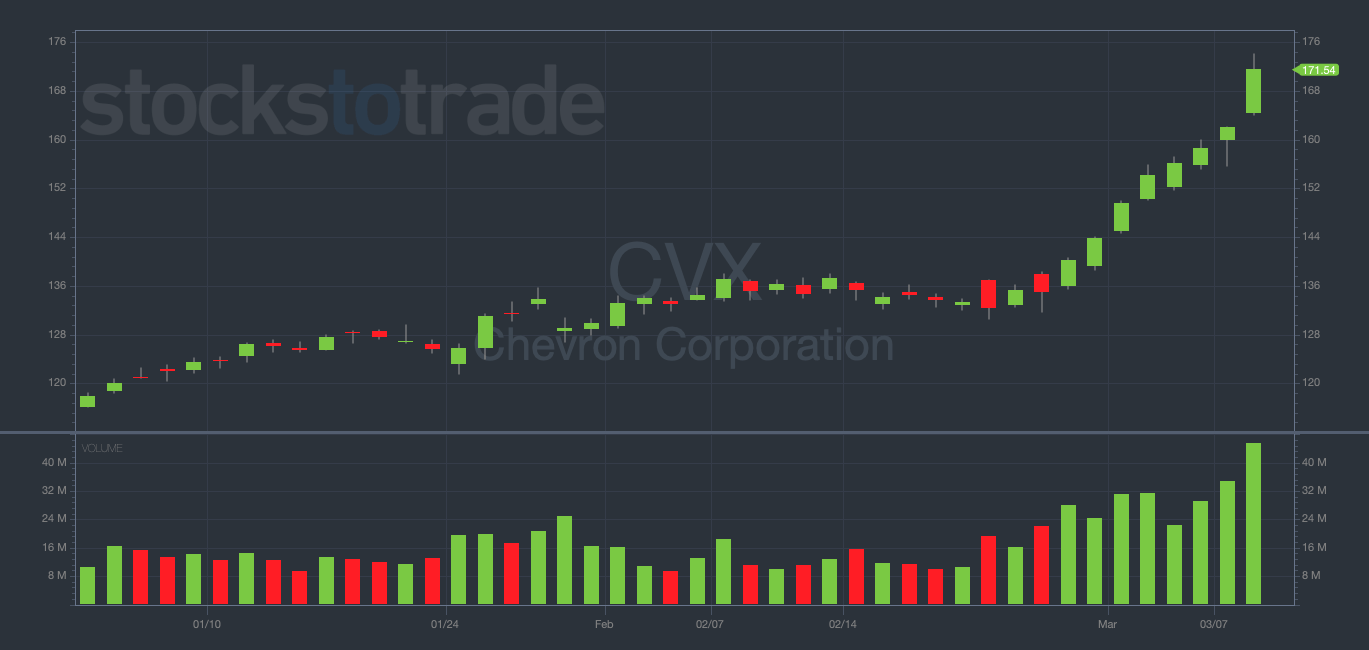
CVX YTD daily chart — courtesy of StocksToTrade.com
Blow-off tops take place when a stock’s share price and trading volume ramp to highs together.
For put-buyers like me, these bearish patterns can present an all-you-can-eat buffet of potential trade setups.
I’ve made more money buying puts on the downside of momentum stocks than I have on any other pattern in my career.
But how do you know when a blow-off top is getting close? What signs can you look for to help you nail the downside?
The 3 Steps to a Blow-Off Top
Let’s discuss the three main ingredients that make up a blow-off top, what they mean, and how you can potentially identify them in the future…
Step 1: Face-Ripping Price Action
Blow-off tops all start the same way — with face-ripping price action. These moves usually look unassuming at first, bubbling up on modest volume…
A few days later, the share price will be surging unstoppably. And unobservant traders will wonder how they missed the boat.
But if you know what to look for, you can usually spot rumors on social media long before the parabolic rally truly gets going.
This is why my personal favorite options to trade are those that are hot at the moment.
I love to trade momentum stocks with volume and volatility (as well as options contracts with high liquidity).
Sound familiar? The recent retail-driven momentum surge in the energy sector checks all of these boxes.
Step 2: Trading Volume Surges
Once a stock has run for several days (or weeks), sitting high on a staircase of face-ripping price action, the challenge is to bet on when exactly you think the rally will end.
NOTE: CVX is a great example of this. The chart’s been green eight trading days in a row. History tells me that the first red day is likely coming sooner rather than later.
As a short seller or put buyer, the art of the trade lies in nailing the top as accurately as possible.
I’ve said it before and I’ll say it again — timing is everything.
Perfectly calling the top is far easier said than done, but paying attention to volume surges can be helpful.
If a stock’s making new all-time highs (as they often are near blow-off tops), the share price valuation can be hard to gauge.
[VIDEO] A Rare Live Interview With Two Millionaire Traders...

To trade options, you DON’T NEED:
❌ A big account…
❌ To stare at your computer all day every day…
❌ A stockbroker…
Because there’s a way to trade stocks (from home) without struggling through the unnecessary risk and hassle most newbies go through…
To get started…
Click here to watch a rare interview between these two millionaire stock traders
In a momentum rally, a variety of factors can send prices beyond any fundamental earnings comparison.
But I think there’s a particularly revealing indicator to track when searching for blow-off tops — trading volume.
If shares exchange hands several times more than a stock’s average daily volume, this is a flashing red light indicating that a near-term top is imminent.
Valuations are dynamic and change with market sentiment, but a company’s total float generally doesn’t change.
In other words, the total number of shares available to trade each day remains the same.
So if the volume’s considerably higher than the daily average, we can have some sense of where the top might be because it’s a historically comparable metric.
Just look at a daily or weekly chart and mark the all-time high volume day…
When the current rally’s volume nears this previous level, a blow-off top could be right around the corner. Trade accordingly.
Step 3: Rejections Near Big, Round Numbers
So how do you pick a price target for calling the top?
Let’s say the stock was $80 two days ago. In this case, is $120 now too expensive … or can it run all the way to $150?
If the share price is nearing a big, round number, you can sometimes identify these levels as resistance.
$50, $100, $1,000 — these multiples of 10 are psychologically important to traders. When a share price nears a big, round number, it can be a natural place for traders to start putting their sell orders in.
This is why we regularly see stocks back off right before they’re about to reach a big round number.
EXAMPLE: USO backing off before it could hit $100.
Every trader is watching the same key price level — and no one wants to be the last person holding the bag.
You deserve to trade efficiently
Trade confidently with powerful tools that can help you research, execute trades and follow market news. 
Once a few sell orders come in (and the share price begins to drop), we often see major capitulation to the downside.
This is even more true in overextended momentum stocks — and exactly why I love to trade these blow-off top setups so much.
So, next time you see a retail-driven momentum runner reaching all-time high trading volume near a big round number … you should seriously consider buying puts.
Is this system perfect? No. Remember that NOTHING is guaranteed in the stock market.
That said, these huge downside moves following blow-off tops are some of the most reliable patterns I’ve followed in my decade-plus as a professional trader.
The Key Levels I’m Watching
Now, back to the two blow-off top setups I’m watching right now — USO and CVX.
And since we were just talking about key price levels … What critical numbers am I watching for in the energy sector?
For USO, I’m watching the $90 area as overhead resistance and the $70 area as potential support. (I’d love to see a squeeze to the high $90s, as $100 could become psychological resistance.)
For CVX, I’m watching $175 as resistance and $150 as support (although it could unwind all the way back to the high $130s).
Final Thoughts
Do I think USO, CVX, and the energy sector at large are getting dangerously close to blow-off top territory? Yes.
Do I know for a fact that oil stocks are gonna tank (excuse the pun) tomorrow? No. There are no guarantees.
But it’s impossible for me to ignore that USO and CVX are clear examples of the three blow-off top ingredients we discussed today.
Watch the oil sector closely for potential five-star put plays over the next few days. I’m predicting massive blow-off tops on the horizon…
Why can’t trader and mentor Tim Bohen stop laughing?
He keeps “owning the hedgies” with this incredible strategy. (And he thinks it’s hilarious!)
To see how this could radically boost your trading, starting tomorrow…
