Listen…
It’s time to take a step back and look at the big picture of the overall market…
I think it’s safe to say that the major indexes are in a correction, with the Invesco QQQ Trust (NASDAQ: QQQ) posting its third red week in a row.
But if you’ve been paying attention, this shouldn’t be a huge surprise to anyone.
Before this correction, the market was in a red-hot momentum cycle as AI euphoria led the tech sector close to all-time highs.
However, the QQQ backed off at $387 before reaching its previous high of $403…
As the market digests this move, I’m continuing to keep an eye on names that have been mainstays on my watchlist all year.
You need to see this…
Keep reading and I’ll break down my current thoughts, key price levels, and technical indicators on two charts I’ve been watching all year…
Nvidia Corporation (NASDAQ: NVDA)
NVDA is the poster child for the AI-driven tech boom of the past several months …
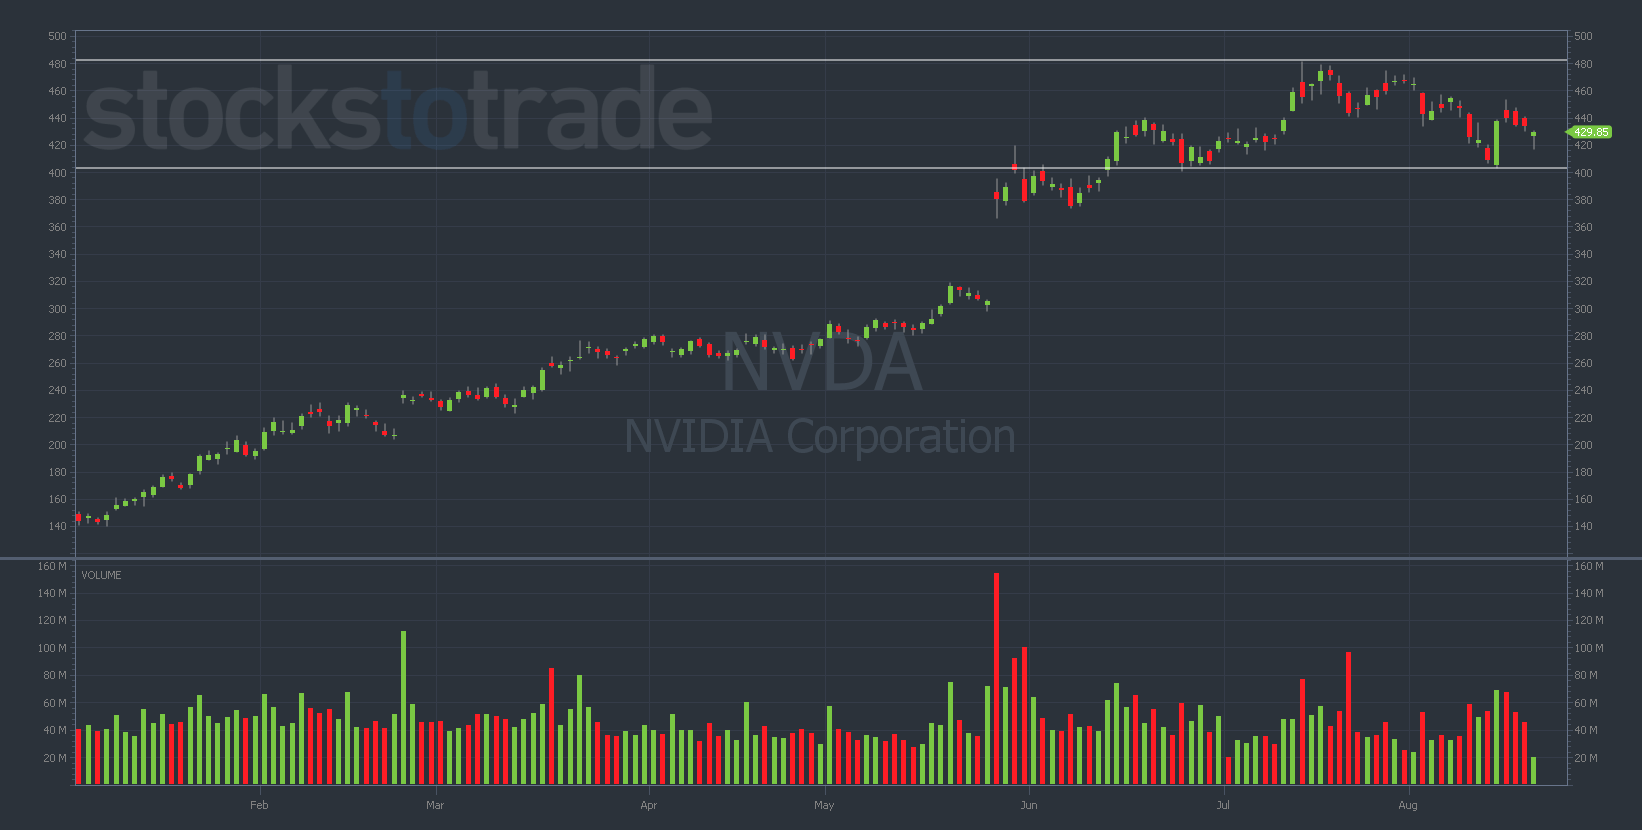
NVDA surged as much as 250% in 2023. No other stock has made as much of an impression on the market as it has…
NVDA YTD daily chart — courtesy of StocksToTrade.com
Of course, when I see a stock get this overbought, I’m on high alert for potential put-trading opportunities.
And I was on the right track on August 4, when I bought NVDA 8/11/2023 $445 Puts…
But in a frustrating move, I played it too safe and sold the puts too early, before NVDA got slammed down to the low $400s.
That said, I think NVDA could drop further. This is the first red month for the stock, so it remains high on my watchlist…
I’ll be watching for ideal entries to catch a potential move down to the $350s.
And what do you know, NVDA reports earnings this week…
This is exactly the sort of volatile catalyst that could send NVDA flying in either direction…
I’m leaning bearish, but this chart (and the earnings report) will need to be watched closely.
Bottom Line: From a momentum standpoint, I don’t see NVDA going higher in the near term.
That said, don’t make up your mind before the price action shows you how the market is reacting.
REMEMBER: Earnings bets are a guessing game. If I do bet on (or trade the reaction to) NVDA earnings, it’ll be a very small position.
Tesla Inc. (NASDAQ: TSLA)
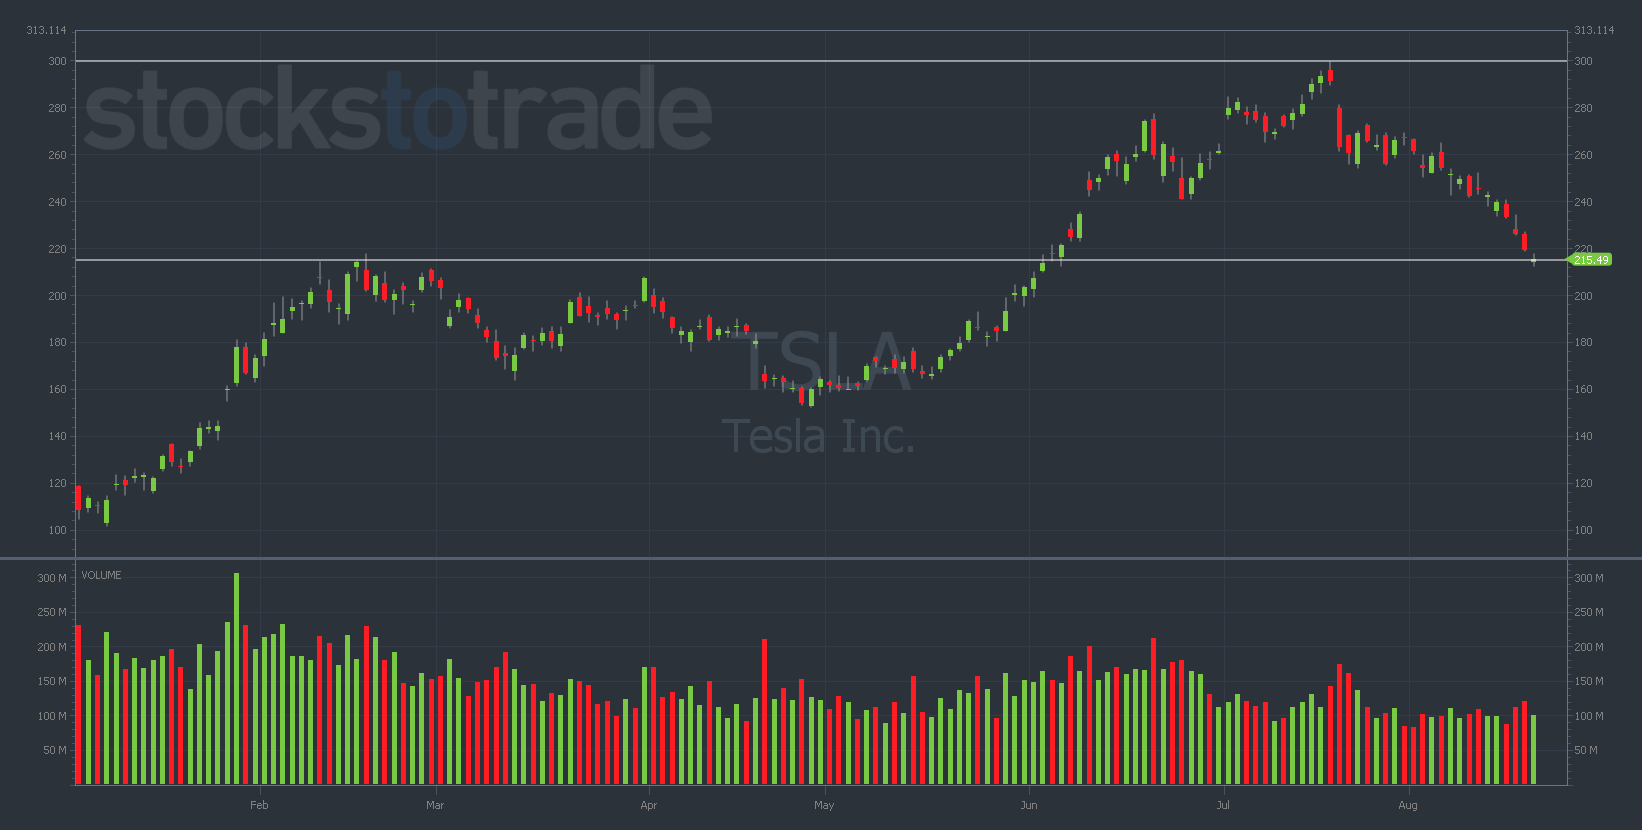
After soaring upwards for several months, TSLA is now in a total freefall…
The stock is still up 99% YTD, but it’s down more than 25% in the past month…
Let’s look at the YTD daily chart…
TSLA YTD daily chart — courtesy of StocksToTrade.com
First, notice where TSLA topped out — $299. This isn’t a coincidence.
I’ve said it before and I’ll say it again … pay close attention when stocks near big round numbers (like $300).
In hindsight, TSLA failing to crack $300 was a slam-dunk put-buying opportunity.
Even if you didn’t make this trade, you can learn from analyzing the chart after the fact. That way, you just might identify a similar setup in the future.
But, for now, the TSLA short setup has passed us by. If anything, I’m looking at TSLA as a potential bounce play (i.e. a call-buying opportunity).
Look at the above chart again. This time, I want you to focus on the bottom line I drew, where TSLA is currently trading…
See how the $213 level lines up with TSLA’s previous highs in February? Again, not a coincidence!
When a stock touches a price level several times, don’t ignore it. You’re probably eyeing a key price level that could potentially lead you to a juicy trading opportunity.
Key price levels are some of the most important technical indicators to grasp. And $213 on the TSLA chart is an extremely important level.
Watch this area on the TSLA chart for a potential bounce play. Wait for the first green day and take it from there.
And speaking of the first green day, I wouldn’t know that pattern at all if I hadn’t started my trading journey where I did…
Are You Ready to Level-Up Your Trading Game?!
You need to hear this…
A great mentor can help guide you toward success in the stock market more than anything else.
I’ll be honest, I was very lucky when I was a newbie trader…
I discovered Tim Sykes’ within my first few months of researching the stock market — and it completely changed my life.
Sykes has helped traders learn to succeed for years. More than 30 of them (including me) are now millionaires.
And the best part?
Every single day, Sykes and his team are hosting live training sessions throughout the day. He discusses what stocks are moving, the opportunities he sees, and the tools he uses to execute these plays.
If you aren’t taking advantage of these zero-cost classes … what are you waiting for?!
CLICK HERE TO SIGN UP TODAY FOR ONE OF OUR FREE, LIVE TRAINING CLASSES!
I’m excited to see you there!
The Next Trillion Dollar Chipmaker After NVDA (Not AI)

Is this little known chipmaker the next NVDA?
It has nothing to do with AI, but this company’s patented chip could generate NVDA sized gains in the coming months…
Companies like Microsoft, Intel, and Google are all quietly racing to be at the forefront of this new phenomenon…
But unfortunately for them…
This one small company holds the key to this revolution…


