Groundbreaking physicist Isaac Newton is best known for his third law of motion, often paraphrased as “what goes up, must come down.”
When Newton first said this in the late 1600s, he obviously wasn’t talking about the stock market (which didn’t even exist yet)…
But nearly 400 years later, Newton’s concept applies perfectly to stocks. In fact, my entire put-trading strategy is based on his idea.
You see, when momentum stocks start raging to the upside … it’s only a matter of time before they face a pullback (or a major crash).
This isn’t a possibility, but rather an inevitability. The question isn’t if a jacked-up momentum chart will crash, only when it’ll happen.
And right now, as the major indexes have been surging, I think it’s time to start thinking like Isaac Newton and look for some names to short.
Keep reading and I’ll break down a few overextended charts I’m watching this week…
Nvidia Corporation (NASDAQ: NVDA)
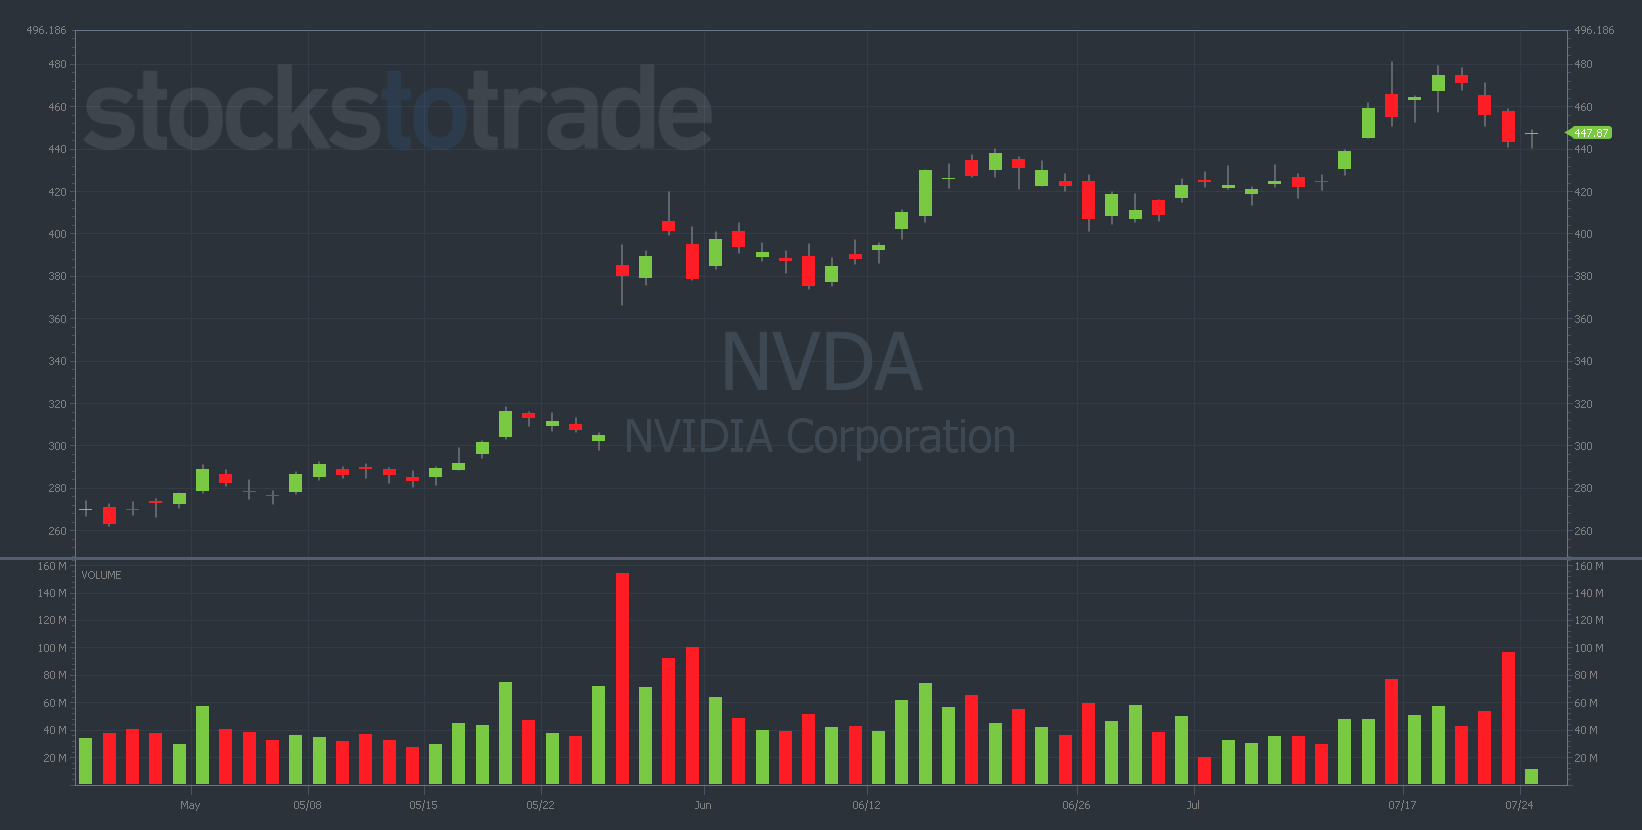
NVDA 3-month daily chart — courtesy of StocksToTrade.com
I’ve written about NVDA so much this year, I’m starting to sound like a broken record.
But it’s for a good reason … there are incredible trading opportunities in this chart if you know where to look and time your moves to perfection.
If you want to read some of my recent commentary on this blazing-hot tech stock, click here.
But this week, the bottom line is this…
NVDA pulled back hard off a major resistance level at $470 but found support at $440 on Monday morning
This is the range to watch. If NVDA fails to hold green and loses the $440 level, I think we could see a bigger fade toward the low $400s this week.
On the other hand, if $440 sticks and the chart starts moving back toward $470, you’ll wanna wait to buy any puts.
This is why I’m keeping a close watch on NVDA and suggest you do the same.
Meta Platforms Inc. (NASDAQ: META)
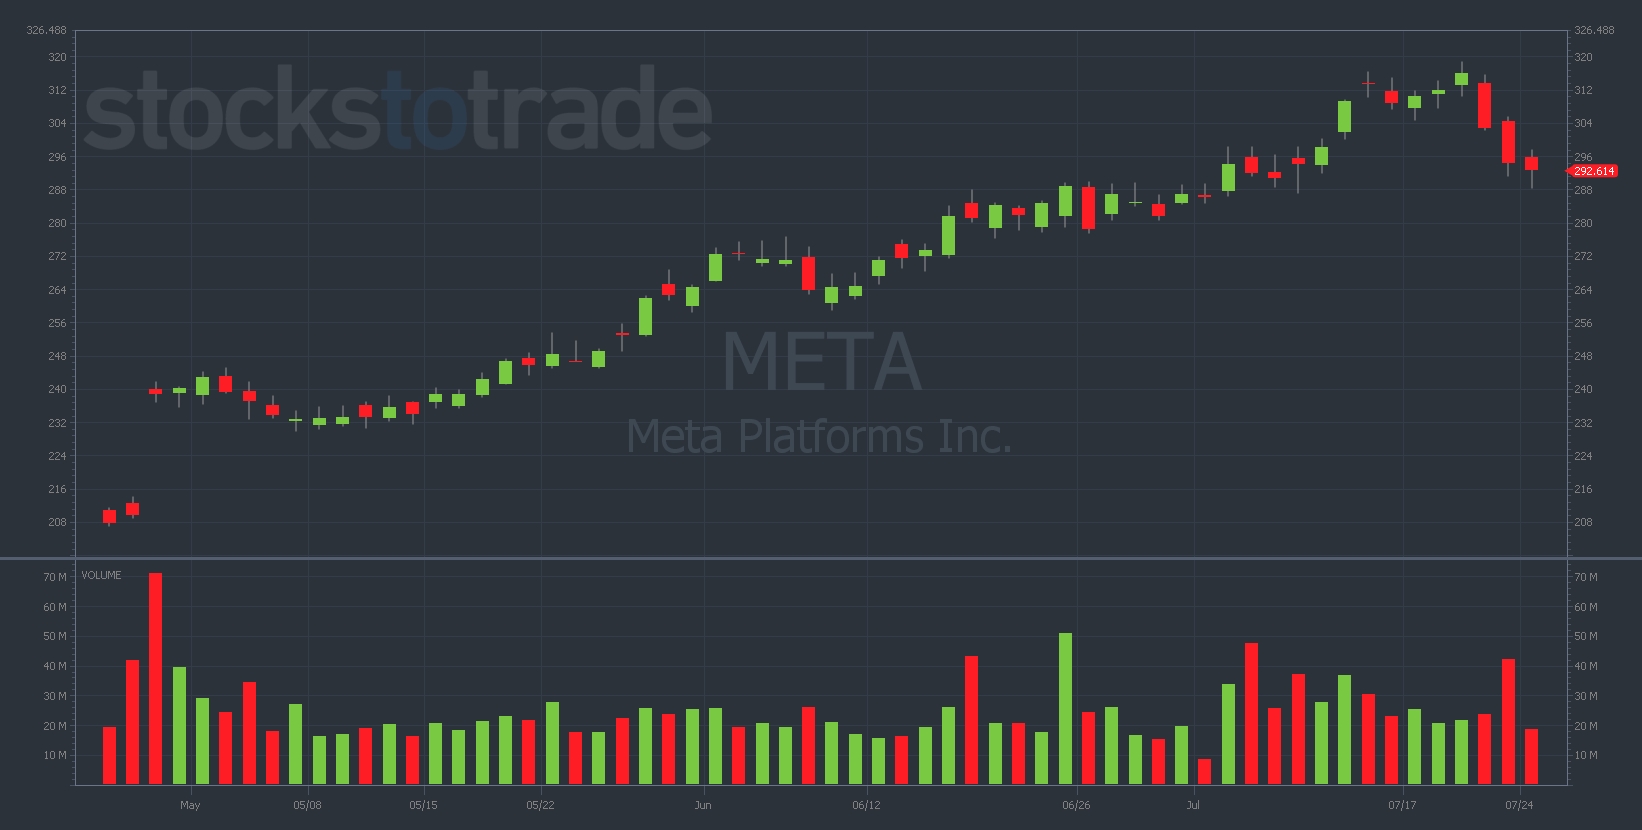
META 3-month daily chart — courtesy of StocksToTrade.com
Like NVDA, META has had a remarkable first half of 2023.
After a brutal rout last year — where META lost more than 80% of its value following the company’s name change and directive shift toward virtual reality — 2023 has sung an entirely different tune.
META is up 134% YTD at the time of writing, making it one of the strongest tech stocks of the year.
But now, the chart is looking almost as overextended as NVDA. I think it’s overdue for a pullback…which we may be starting to see the beginnings of.
META had a sizeable pullback off of June 18’s $318 highs. It looks to have put in a definitive top on the weekly chart.
I’ll consider buying puts on a bounce back over $300 as I think this chart could very likely fade further down toward the $270s either this week or next.
Carvana Inc. (NYSE: CVNA)
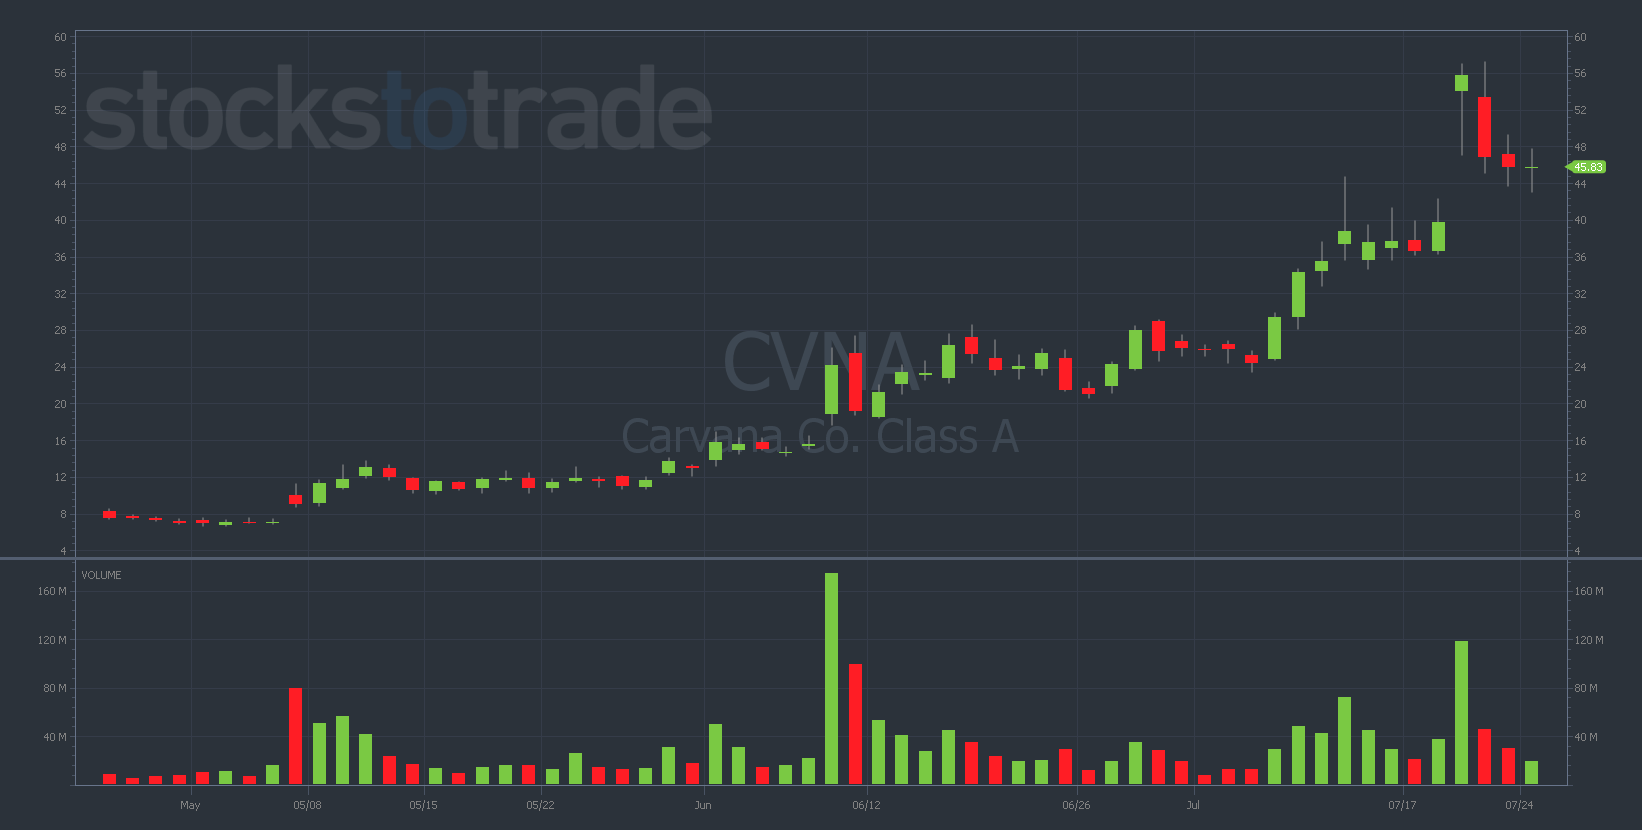
CVNA 3-month daily chart — courtesy of StocksToTrade.com
I spoke about CVNA yesterday in relation to another stock we’ll briefly discuss today, but it’s worth drilling down a bit further.
I mentioned the distinct possibility of $50 on this name and, sure enough, guess what happened?
CVNA reported better-than-expected earnings last week and shorts were squeezed into oblivion.
Around this catalyst, on July 18, I decided to make a speculative bet on CVNA that I didn’t alert.
I bought 100 7/21/2023 $45 CVNA Calls for $1.26, risking $12,620.98.
I sold the calls the following morning for $8.80 per contract, $87,978.06 total.
This was a gain of 598% and a total profit of $75,400!
However, I must point out that I got lucky on this play. It was risky, and that’s why I didn’t alert it.
That said, I never would’ve had the opportunity to get lucky on this play had I not prepared myself.
I’ve been watching CVNA for weeks, waiting for the right opportunities for both calls and puts.
Here’s my point … By studying hard and doing proper due diligence, you’ll set yourself up for success in a number of ways.
You can conventionally nail a trade with an airtight thesis (which is ideal), but you can also get lucky (not preferable, but acceptable).
However, getting lucky is impossible if you’re not prepared.
Now, CVNA would’ve also been a great puts play in the $55+ area. Ideally, I would’ve bought puts near $55 and played both sides of the chart.
But here, I’ll only consider CVNA puts if it bounces back to resistance. No play for me now otherwise.
Honorable Mention: Nikola Corporation (NASDAQ: NKLA)
I wrote about my thesis behind my NKLA puts trade at length yesterday. If you missed it, you can read my full breakdown here.
But the bottom line is this…
NKLA is a worthless junk stock that’s up as much as 500% off its lows. I think it’s currently offering solid risk/reward to the downside.
I’m holding a small puts position, looking for pull back to $2 (or even the $1.80-$1.90 range), which could potentially offer up to 50% upside on the trade if the move plays out as expected.
Final Thoughts
I know I’ve talked about these stocks a lot recently, but there’s a good reason for that…
I’m zeroing in on where I feel the best trading opportunities are. However, you must remember one thing when attempting to short overextended charts…
Timing is everything! Momentum stocks always crash, but there’s no guarantee of the timing of the move. Be very deliberate with your timing when shorting strong runners!


