If your goal is to be a successful options trader, your ability to identify excellent setups will be crucial to your journey.
But there’s a certain mystery to this … How exactly do great traders know which charts to trade, and which to leave alone?
When I was first starting in Tim Sykes’ Trading Challenge, I was blown away by Sykes’ ability to look at a chart and know exactly how to trade it.
It wasn’t until I’d spent several months learning from Sykes, absorbing his wisdom like a sponge, that I figured out how he identified his setups…
At the end of the day, it all comes down to chart patterns.
Sykes taught me how to look at a chart and read between the moving averages, share prices, and technical indicators to see the tradeable patterns beneath.
Through practice, I discovered the chart patterns that work best for my strategy and learned how to identify them in the market.
And now, I’d like to share with you four indispensable chart patterns that every Evolver should be on the lookout for…
The First Green Day Pattern
A main pillar of my trading strategy is trying to time pattern reversals.
After a stock has been green (or red) for several days (or weeks) in a row, the risk/reward is best trading in the opposite direction of the trend.
But this is only true if you time the reversal perfectly … which is where the first green day pattern comes into play.
First green days emerge on … you guessed it … the first green day after a stock has been in a steady downtrend…
Following several red daily closes in a row, the first green day can cause a huge surge to the upside as shorts cover and bulls rally.
I use this pattern constantly in my trading…
Example: Back in February, I nailed the first green day pattern trading Microsoft Corp. (NASDAQ: MSFT) — read my full trade breakdown here.
When searching on your own, look at daily and weekly charts to find potential first-green-day setups.
And if you see a long string of red candles punctuated by a single green soldier … don’t ignore it.
The First Red Day Pattern
This one’s simple … the first red day is simply the opposite of the first green day.
Once a stock’s been surging for weeks or months without a dip, the first red day is usually right around the corner.
Because of the nature of options pricing, catching the first red day by buying cheap puts can be an extremely profitable game plan.
This is the basis of my entire put-trading strategy … What goes up, must come down!
And when stocks go full-supernova, that’s an even greater indicator that some major downside is imminent (but more on that later)…
Just like first green days, you should be searching for first red day patterns on the daily and weekly charts.
Then, if you notice a chart is finally starting to crack after a prolonged surge … you should seriously consider trading puts on that name.
Double Tops and Double Bottoms
You should know by now that when a stock hits a hard level of support or resistance, a major shift in price action can occur.
But when a stock fails to breach the exact same support or resistance level two or more times in a short period, the chances of a major move increase exponentially.
I’m talking about double bottoms and double tops, respectively. Let me explain…
If a stock touches the $10 level on the downside twice but doesn’t trade below it, that’s a double bottom and a potentially bullish indicator.
If a stock touches the $100 level twice on the upside but doesn’t exceed it, that’s a double top and a potentially bearish indicator.
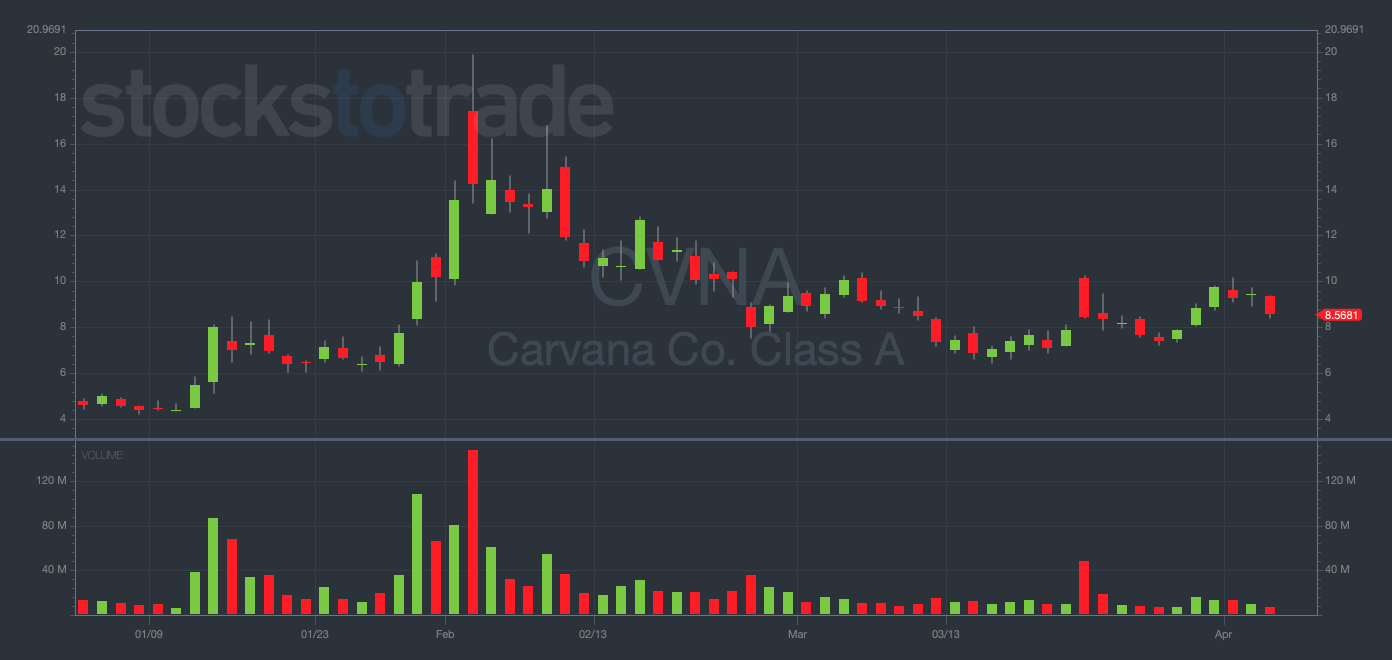
Example: In late January, Carvana Co. (NYSE: CVNA) established a bottoming level in the mid-$6s. It then re-tested this level in March, forming a double bottom. Over the next five trading days, CVNA surged from $6.50 to $10.10 — a gain of 55%.

CVNA YTD daily chart — courtesy of StocksToTrade.com
Both of these patterns can be incredibly telling as to where the chart is headed next. It makes sense if you think about it logically…
If a chart can’t get past a certain level, that tells me that level is supported (or resisted) by a large block of orders.
That doesn’t mean the wall can’t eventually be taken down, but fighting against big money trying to keep a stock above (or below) a certain price is usually a losing proposition.
My advice? Don’t try to fight extreme support and resistance…
Instead, use these levels as opportunities to ride the reverse momentum when stocks fail to crack them.
The Supernova Pattern
It’s rare for a stock to move up 50-100% in a single trading day, but it’s not impossible…
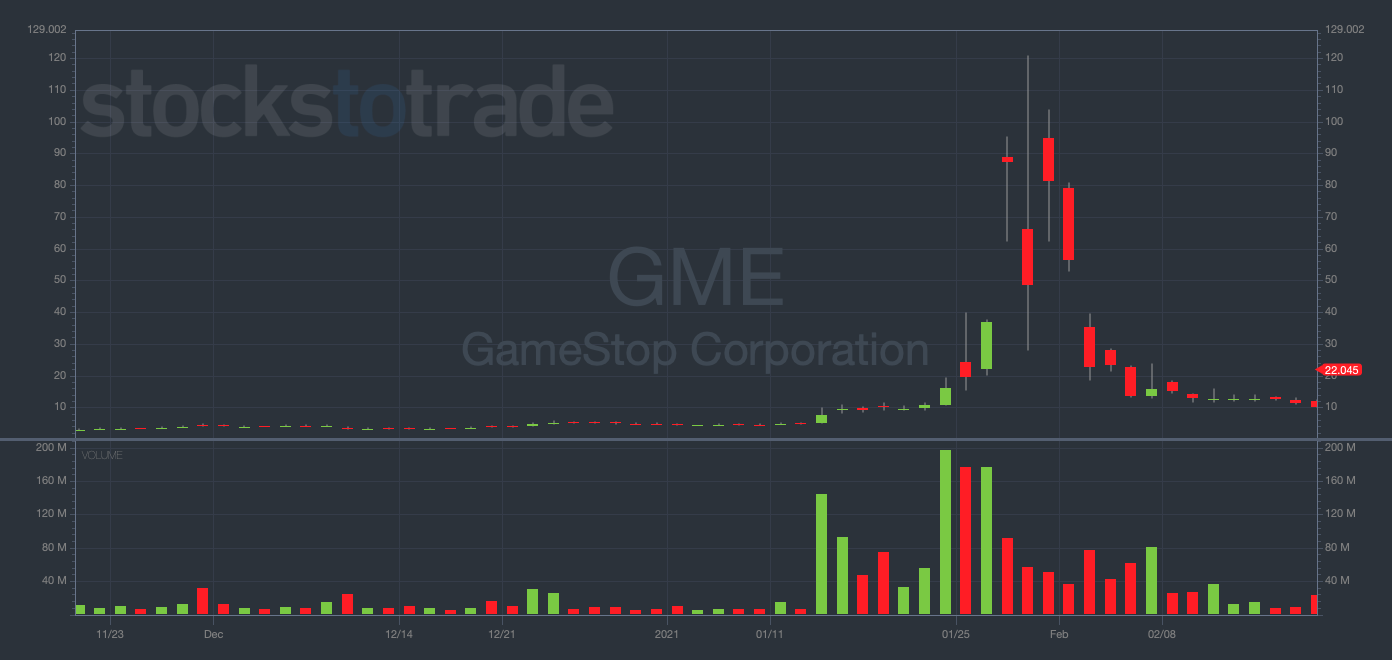
Remember GameStop Corp. (NYSE: GME), AMC Entertainment Holdings Inc. (NYSE: AMC), Bed Bath & Beyond Inc. (NASDAQ: BBBY), Revlon Inc. (OTCMKTS: REVRQ), and Support.com, Inc.?

GME daily chart (from January 2021) — courtesy of StocksToTrade.com
In all of these cases, a single news catalyst caused these trashy stocks to multiply several times in a few weeks. And this is what Tim Sykes calls The Supernova Pattern.
Supernovas are simply stocks that have huge % gains over a short period. Sometimes these moves can happen in a single trading day.
Other times, the stock can go on multi-day (or multi-week) rallies and soar hundreds (or even thousands) of % in just a few weeks.
In recent times, short squeezes have been a major catalyst for supernova patterns.
You can attempt to catch the rip-roaring upside on these stocks, which can be highly profitable if timed correctly.
But personally, my style is to wait for the first red day within a supernova pattern, which can quickly form into a nasty blow-off top. Think about it…
Stocks that are up hundreds of % in a few weeks are inevitably due for a major crash.
Better yet, you can potentially bolster your conviction in an imminent crash by paying close attention to the daily trading volume.
When a supernova stock is nearing a blow-off top first red day, the volume is usually two to five times the average daily trading volume.
I’ve made some massive trades by timing the downside on supernovas, which is why it remains one of my favorite patterns.
Final Thoughts
The ability to recognize tradeable patterns is crucial to your potential success.
And these four patterns changed my life.
By paying attention to these patterns on daily and weekly charts, you could set yourself up to see opportunities that your peers are missing.
SPECIAL NOTE: The market is closed tomorrow for Good Friday and I was off yesterday for Passover. Happy holidays to all!


