You can learn all of the trading lessons in the world, but they won’t mean anything if you can’t put them into action…
At some point, you have to take all of the market knowledge you’ve gathered and start actually putting it to work in the markets…
Speaking of that, today I’ll walk you through my thought process behind my recent calls trade on a particular crypto stock.
SPOILER ALERT: This trade was triggered by identifying one of my favorite chart patterns of all time.
So, if you’d like to understand why this pattern tends to work and how you can potentially identify similar setups in the future…
Keep reading to see how one of my bread-and-butter chart patterns led me to a textbook-long trade…
Identifying COIN’s First Green Day
Yesterday, I saw a familiar chart pattern appear on a highly volatile stock — Coinbase Global Inc. (NYSE: COIN).
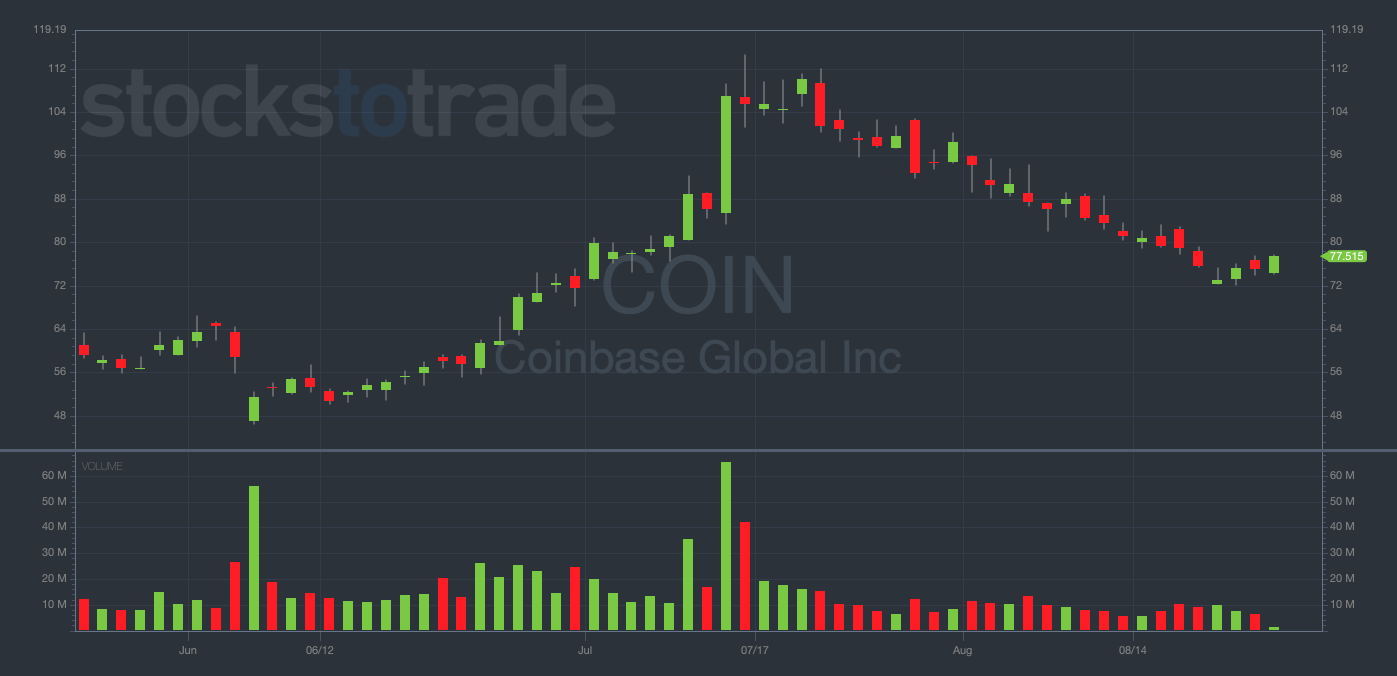
COIN 3-month daily chart — courtesy of StocksToTrade.com
The trading day started well for COIN as the stock surged from $74 to $76 in the first 30 minutes of trading.
This caught my eye because of the context…
BIG PICTURE: I felt that a lot of ‘weak hands’ had been flushed out of crypto stocks over the last few days, providing a good backdrop for me to potentially capitalize on one of my favorite chart patterns…
After being stuck in a brutal downtrend for nearly six weeks, the stock was green at the open, implying the start of a first green day pattern.
The first green day is one of my absolute favorite patterns to trade (and it works just like it sounds).
The pattern occurs when a stock finally prints a green day after a long string of lower opens.
Those who have followed my trading for years know that I have a negative bias. (I often prefer to buy puts than calls, but it all depends on the chart…)
And if I’m gonna go long and buy calls … I often do so on the first green day.
Why does this pattern tend to work so well?
The first green day pattern is related to momentum and relative strength. Stocks can only go up or down in a straight line for so long.
WARNING: No trend lasts forever!
Once a stock is already in a steady downtrend, I’m usually not looking to short it…
Rather, I’m waiting to make the contrarian bet and go long once it shows initial signs of strength…
And that, my friends, is where the first green day comes into play.
After seeing the beginnings of a strong green daily candle forming, I knew I wanted to go long on COIN.
From there, it was about perfecting my game plan for the trade by picking the correct entry point, strike price, and expiration date…
How I Chose My Entry Point
I got long COIN calls at 11:27 a.m. Eastern. At the time, COIN was trading for right around $76.
I was encouraged to see the stock hold the $76 area throughout the morning.
This was a clear sign of strength that gave me the confidence to buy calls into the afternoon.
But once I knew I wanted to buy calls, I had to choose the right strike price and expiration date…
And these two choices are related. If you buy near-dated calls, you generally want to pick a strike price that’s close to the money (or even at the money).
If you buy a longer-dated expiration, you can potentially stretch out and buy a slightly further out strike price.
I identified a range for COIN between $76 and $80 and I thought the move would happen pretty quickly if it was going to happen at all.
So, I decided to buy at the money calls expiring this Friday — specifically, 25 COIN 08/25/2023 $76 Calls for $2.06.
At the time of writing, I’m still holding the calls. I’ll probably sell them before the day is over.
But right now, I want you to focus on how I identified and executed my entry into this trade.
There are few patterns that work as consistently as the first green day. I think it’s a remarkable pattern that everyone should try using.
However, every trader is unique. Just because a pattern works for me doesn’t mean that it’ll work for you.
I had to put the first green day pattern into action over and over again before I knew it fit into my strategy.
What I’m getting at is this…
At this point in your trading journey, you should be trying out a variety of different patterns and setups to find what feels right.
Later in the week, I’ll break down the second half of this trade — how I exited.
But first, I want to bring your attention to a very exciting event coming up…
The Rogue Trading Summit
On Thursday, August 31st at 8 pm Eastern, Tim Sykes is going to sit down with one of the biggest hedge fund legends of our time … Jeff Zananiri.
During this exclusive interview, Jeff will blow the lid off a phenomenon that his hedge fund, Pan Capital, used to turn $5.1 million into over $700 million and go 10 straight years without a single losing quarter.
I mean … are you kidding me?! These results are INSANE.
It’s not every day you get the opportunity to hear the whole truth from a trusted source — a seasoned veteran, like Jeff, with years of experience in the trenches of Wall Street…
Please Remember: Due to the controversial nature of what Jeff will be sharing, this private broadcast is limited…
So, it’s vitally important to immediately claim your seat to Tim and Jeff’s big reveal.
What are you waiting for?!
Click here NOW to RESERVE YOUR SPOT for the Rogue Trading Summit!


